 Found 450 with Last Name = 'lo' and Initial = 'yc'
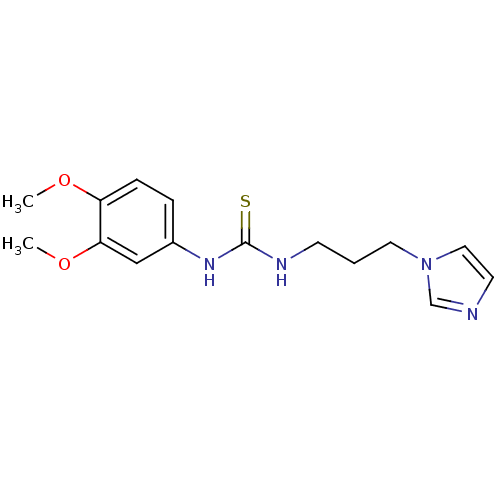
Affinity DataKi: 95nM ΔG°: -40.1kJ/molepH: 8.0 T: 2°CAssay Description:The testing for the inhibition activities of imidazole derivatives and cacodylate on gQC and sQC was evaluated at 25 C using the fluorescent substrat...More data for this Ligand-Target Pair
 3D Structure (crystal)
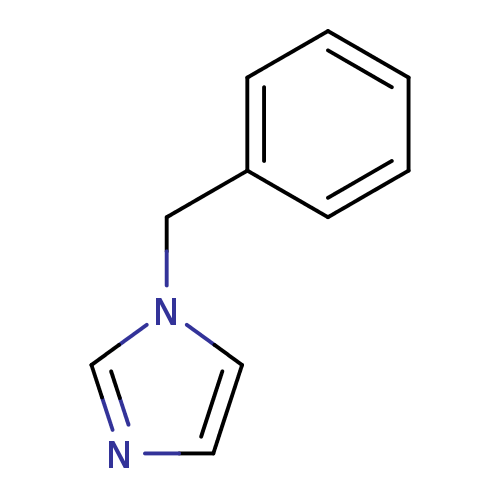
Affinity DataKi: 262nM ΔG°: -37.6kJ/molepH: 8.0 T: 2°CAssay Description:The testing for the inhibition activities of imidazole derivatives and cacodylate on gQC and sQC was evaluated at 25 C using the fluorescent substrat...More data for this Ligand-Target Pair
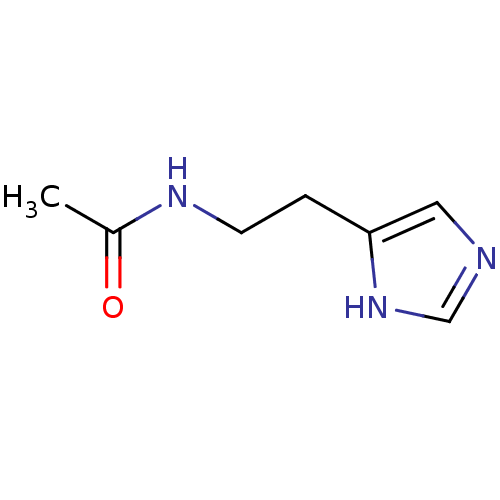
Affinity DataKi: 607nM ΔG°: -35.5kJ/molepH: 8.0 T: 2°CAssay Description:The testing for the inhibition activities of imidazole derivatives and cacodylate on gQC and sQC was evaluated at 25 C using the fluorescent substrat...More data for this Ligand-Target Pair
Affinity DataKi: 1.70E+3nM ΔG°: -32.9kJ/molepH: 8.0 T: 2°CAssay Description:The testing for the inhibition activities of imidazole derivatives and cacodylate on gQC and sQC was evaluated at 25 C using the fluorescent substrat...More data for this Ligand-Target Pair
Affinity DataKi: 1.82E+3nM ΔG°: -32.8kJ/molepH: 8.0 T: 2°CAssay Description:The testing for the inhibition activities of imidazole derivatives and cacodylate on gQC and sQC was evaluated at 25 C using the fluorescent substrat...More data for this Ligand-Target Pair
Affinity DataKi: 5.75E+3nM ΔG°: -29.9kJ/molepH: 8.0 T: 2°CAssay Description:The testing for the inhibition activities of imidazole derivatives and cacodylate on gQC and sQC was evaluated at 25 C using the fluorescent substrat...More data for this Ligand-Target Pair

Affinity DataKi: 1.82E+6nM ΔG°: -15.6kJ/molepH: 8.0 T: 2°CAssay Description:The testing for the inhibition activities of imidazole derivatives and cacodylate on gQC and sQC was evaluated at 25 C using the fluorescent substrat...More data for this Ligand-Target Pair
Affinity DataKi: 6.70E+6nM ΔG°: -12.4kJ/molepH: 8.0 T: 2°CAssay Description:The testing for the inhibition activities of imidazole derivatives and cacodylate on gQC and sQC was evaluated at 25 C using the fluorescent substrat...More data for this Ligand-Target Pair
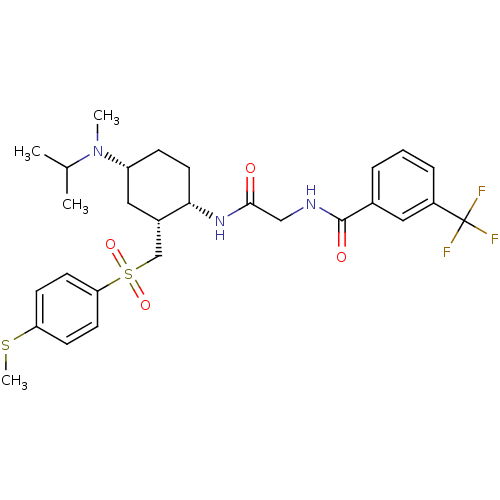
Affinity DataIC50: 0.200nMAssay Description:Antagonist activity at CCR2 in human PBMC assessed as MCP1-induced chemotaxisMore data for this Ligand-Target Pair
Affinity DataIC50: 0.300nMAssay Description:Antagonist activity at CCR2 in human PBMC assessed as MCP1-induced calcium flux by fluorescence-imaging plate reader assayMore data for this Ligand-Target Pair
Affinity DataIC50: 0.300nMAssay Description:Displacement of [125I]-MCP1 from CCR2 in human THP1 cells after 30 minsMore data for this Ligand-Target Pair
Affinity DataIC50: 0.370nMAssay Description:Displacement of [125I]MCP1 from CCR2 in human PBMC by millipore filter plate assayMore data for this Ligand-Target Pair

Affinity DataIC50: 0.400nMAssay Description:Displacement of [125I]-MCP1 from CCR2 in human THP1 cells after 30 minsMore data for this Ligand-Target Pair
Affinity DataIC50: 0.5nMAssay Description:Antagonist activity at CCR2 in human PBMC assessed as MCP1-induced calcium flux by fluorescence-imaging plate reader assayMore data for this Ligand-Target Pair
Affinity DataIC50: 0.5nMAssay Description:Antagonist activity at CCR2 in human PBMC assessed as inhibition of MCP1-induced chemotaxis after 45 mins in presence of 0.1 M bovine serum albuminMore data for this Ligand-Target Pair
Affinity DataIC50: 0.5nMAssay Description:Antagonist activity at human CCR2 in PBMCs assessed as inhibition of chemotaxisMore data for this Ligand-Target Pair
Affinity DataIC50: 0.700nMAssay Description:Antagonist activity at CCR2 in human PBMC assessed as MCP1-induced calcium flux by fluorescence-imaging plate reader assayMore data for this Ligand-Target Pair

Affinity DataIC50: 0.800nMAssay Description:Displacement of [125I]-MCP1 from CCR2 in human THP1 cells after 30 minsMore data for this Ligand-Target Pair
Affinity DataIC50: 0.800nMAssay Description:Displacement of [125I]-MCP1 from CCR2 in human THP1 cells after 30 minsMore data for this Ligand-Target Pair

Affinity DataIC50: 0.900nMAssay Description:Binding affinity to CCR2More data for this Ligand-Target Pair

Affinity DataIC50: 0.950nMAssay Description:Displacement of radiolabeled MCP1 from CCR2 in human PBMC by millipore filter plate assayMore data for this Ligand-Target Pair
Affinity DataIC50: 1nMAssay Description:Displacement of [125I]-MCP1 from CCR2 in human THP1 cells after 30 minsMore data for this Ligand-Target Pair

Affinity DataIC50: 1nMAssay Description:Antagonist activity at human CCR2 in PBMCs assessed as inhibition of chemotaxisMore data for this Ligand-Target Pair
Affinity DataIC50: 1nMAssay Description:Antagonist activity at CCR2 in human PBMC assessed as MCP1-induced chemotaxisMore data for this Ligand-Target Pair

Affinity DataIC50: 1.10nMAssay Description:Antagonist activity at CCR2 in human PBMC assessed as MCP1-induced chemotaxisMore data for this Ligand-Target Pair

Affinity DataIC50: 1.20nMAssay Description:Binding affinity to CCR2More data for this Ligand-Target Pair
Affinity DataIC50: 1.30nMAssay Description:Displacement of [125I]MCP1 from CCR2 in human PBMC by millipore filter plate assayMore data for this Ligand-Target Pair
Affinity DataIC50: 1.30nMAssay Description:Displacement of [125I]MCP1 from CCR2 in human PBMC by millipore filter plate assayMore data for this Ligand-Target Pair
Affinity DataIC50: 1.30nMAssay Description:Antagonist activity at CCR2 in human PBMC assessed as inhibition of MCP1-induced chemotaxis after 45 mins in presence of 0.1 M bovine serum albuminMore data for this Ligand-Target Pair
Affinity DataIC50: 1.40nMAssay Description:Displacement of [125I]MCP1 from CCR2 in human PBMC by millipore filter plate assayMore data for this Ligand-Target Pair

Affinity DataIC50: 1.5nMAssay Description:Antagonist activity at CCR2 in human PBMC assessed as MCP1-induced calcium flux by fluorescence-imaging plate reader assayMore data for this Ligand-Target Pair
Affinity DataIC50: 1.60nMAssay Description:Antagonist activity at CCR2 in human PBMC assessed as inhibition of MCP1-induced chemotaxis after 45 mins in presence of 0.5 M bovine serum albuminMore data for this Ligand-Target Pair

Affinity DataIC50: 1.80nMAssay Description:Displacement of radiolabeled MCP1 from CCR2 in human PBMC by millipore filter plate assayMore data for this Ligand-Target Pair

Affinity DataIC50: 1.90nMAssay Description:Binding affinity to CCR2More data for this Ligand-Target Pair

Affinity DataIC50: 1.90nMAssay Description:Binding affinity to CCR2More data for this Ligand-Target Pair

Affinity DataIC50: 2nMAssay Description:Antagonist activity at CCR2 in human monocytes assessed as inhibition of MCP1-induced calcium influx by FLIPRMore data for this Ligand-Target Pair

Affinity DataIC50: 2nMAssay Description:Antagonist activity at CCR2 in human monocytes assessed as inhibition of MCP1-induced calcium influx by FLIPRMore data for this Ligand-Target Pair

Affinity DataIC50: 2nMAssay Description:Antagonist activity at CCR2 in human PBMC assessed as MCP1-induced calcium flux by fluorescence-imaging plate assayMore data for this Ligand-Target Pair
Affinity DataIC50: 2nMAssay Description:Antagonist activity at CCR2 in human PBMC assessed as MCP1-induced calcium flux by fluorescence-imaging plate assayMore data for this Ligand-Target Pair

Affinity DataIC50: 2.05nMAssay Description:Displacement of [125I]MCP1 from CCR2 in human PBMC by millipore filter plate assayMore data for this Ligand-Target Pair
Affinity DataIC50: 2.10nMAssay Description:Displacement of [125-I]MCP1 from CCR2 on human PBMCMore data for this Ligand-Target Pair

Affinity DataIC50: 2.30nMAssay Description:Antagonist activity at CCR2 in human PBMC assessed as MCP1-induced chemotaxisMore data for this Ligand-Target Pair

Affinity DataIC50: 2.40nMAssay Description:Antagonist activity at CCR2 in human monocytes by chemotaxis assay in presence of 0.5% bovine serum albuminMore data for this Ligand-Target Pair
Affinity DataIC50: 2.40nMAssay Description:Displacement of [125I]MCP1 from CCR2 in human PBMCsMore data for this Ligand-Target Pair

Affinity DataIC50: 2.40nMAssay Description:Displacement of [125I]MCP1 from CCR2 in human PBMCsMore data for this Ligand-Target Pair
Affinity DataIC50: 2.5nMAssay Description:Antagonist activity at CCR2 in human PBMC assessed as MCP1-induced chemotaxisMore data for this Ligand-Target Pair

Affinity DataIC50: 2.5nMAssay Description:Displacement of [125-I]MCP1 from CCR2 on human PBMCMore data for this Ligand-Target Pair

Affinity DataIC50: 2.70nMAssay Description:Displacement of [125I]MCP1 from CCR2 in human PBMC by millipore filter plate assayMore data for this Ligand-Target Pair

Affinity DataIC50: 2.80nMAssay Description:Binding affinity to CCR2More data for this Ligand-Target Pair
Affinity DataIC50: 3nMAssay Description:Antagonist activity at CCR2 in human PBMC assessed as MCP1-induced calcium flux by fluorescence-imaging plate assayMore data for this Ligand-Target Pair