 Found 16 Enz. Inhib. hit(s) with all data for entry = 1258
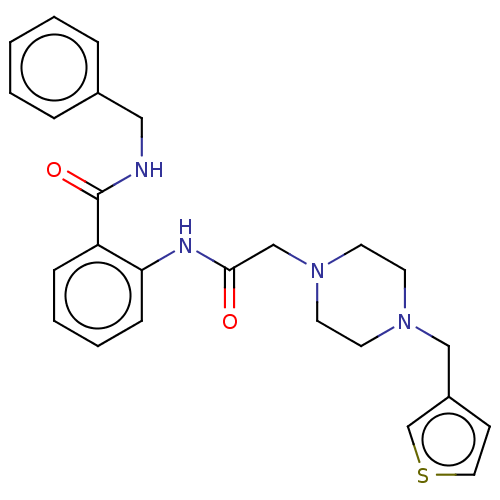
Affinity DataIC50: 0.270nMAssay Description:The studies began by screening for the optimal protein concentrations for the method. The studies were conducted in goat anti-mouse IgG coated black ...More data for this Ligand-Target Pair
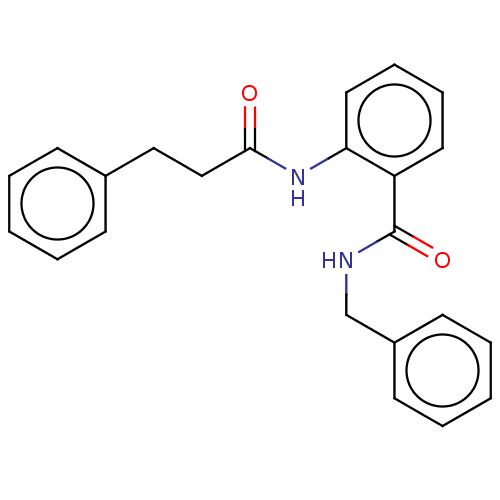
Affinity DataIC50: 0.330nMAssay Description:The studies began by screening for the optimal protein concentrations for the method. The studies were conducted in goat anti-mouse IgG coated black ...More data for this Ligand-Target Pair
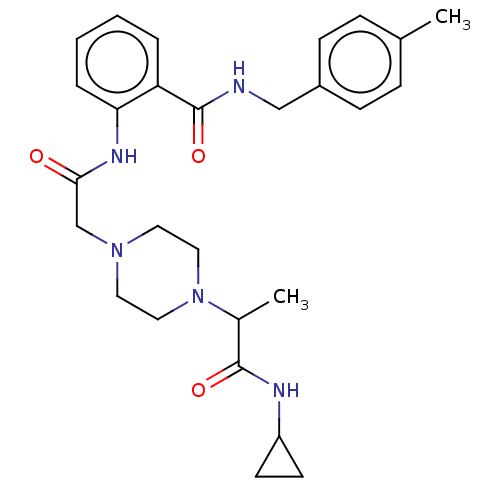
Affinity DataIC50: 0.460nMAssay Description:The studies began by screening for the optimal protein concentrations for the method. The studies were conducted in goat anti-mouse IgG coated black ...More data for this Ligand-Target Pair
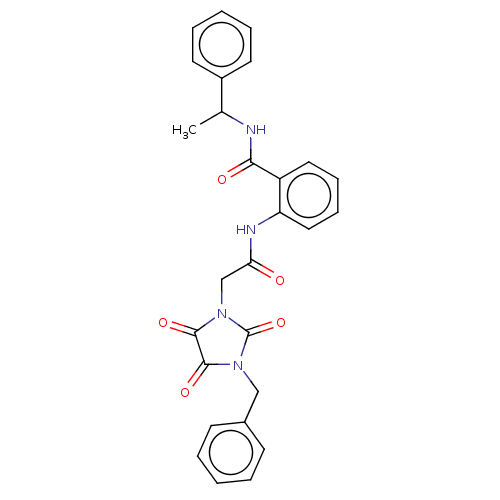
Affinity DataIC50: 0.610nMAssay Description:The studies began by screening for the optimal protein concentrations for the method. The studies were conducted in goat anti-mouse IgG coated black ...More data for this Ligand-Target Pair
Affinity DataIC50: 0.640nMAssay Description:The studies began by screening for the optimal protein concentrations for the method. The studies were conducted in goat anti-mouse IgG coated black ...More data for this Ligand-Target Pair
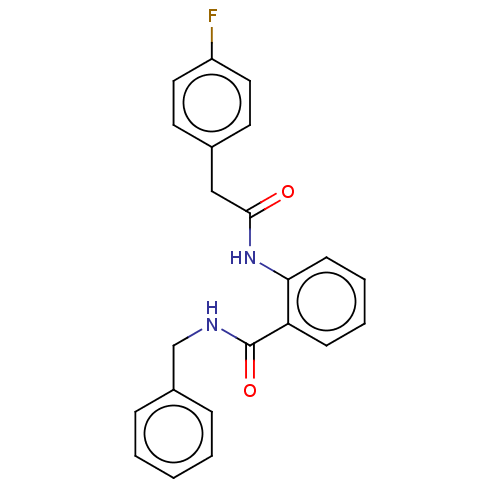
Affinity DataIC50: 0.890nMAssay Description:The studies began by screening for the optimal protein concentrations for the method. The studies were conducted in goat anti-mouse IgG coated black ...More data for this Ligand-Target Pair
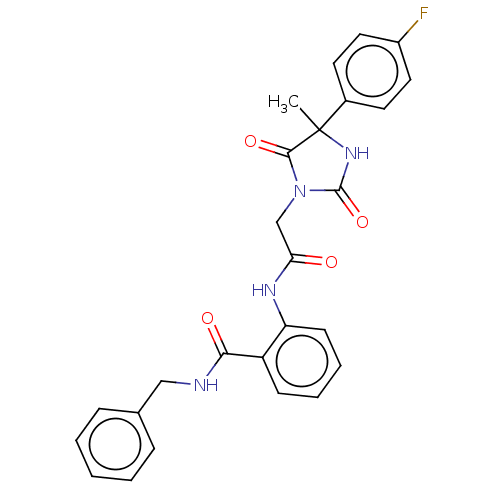
Affinity DataIC50: 0.980nMAssay Description:The studies began by screening for the optimal protein concentrations for the method. The studies were conducted in goat anti-mouse IgG coated black ...More data for this Ligand-Target Pair
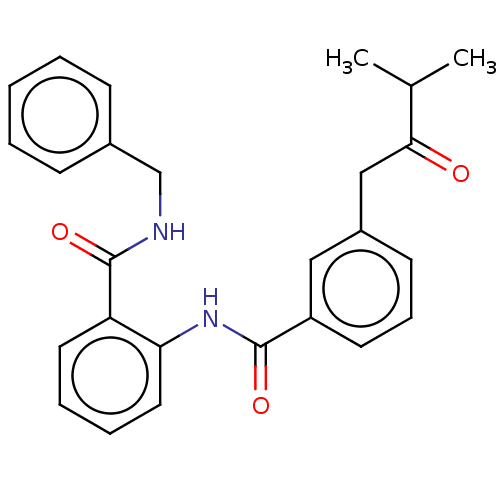
Affinity DataIC50: 1.23nMAssay Description:The studies began by screening for the optimal protein concentrations for the method. The studies were conducted in goat anti-mouse IgG coated black ...More data for this Ligand-Target Pair

Affinity DataIC50: 1.53nMAssay Description:The studies began by screening for the optimal protein concentrations for the method. The studies were conducted in goat anti-mouse IgG coated black ...More data for this Ligand-Target Pair

Affinity DataIC50: 1.64nMAssay Description:The studies began by screening for the optimal protein concentrations for the method. The studies were conducted in goat anti-mouse IgG coated black ...More data for this Ligand-Target Pair

Affinity DataIC50: 2.19nMAssay Description:The studies began by screening for the optimal protein concentrations for the method. The studies were conducted in goat anti-mouse IgG coated black ...More data for this Ligand-Target Pair
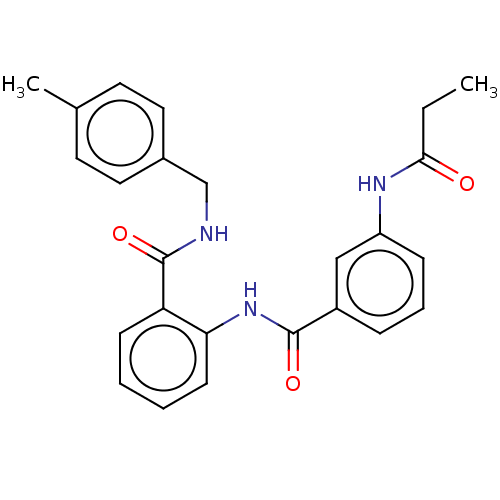
Affinity DataIC50: 2.45nMAssay Description:The studies began by screening for the optimal protein concentrations for the method. The studies were conducted in goat anti-mouse IgG coated black ...More data for this Ligand-Target Pair
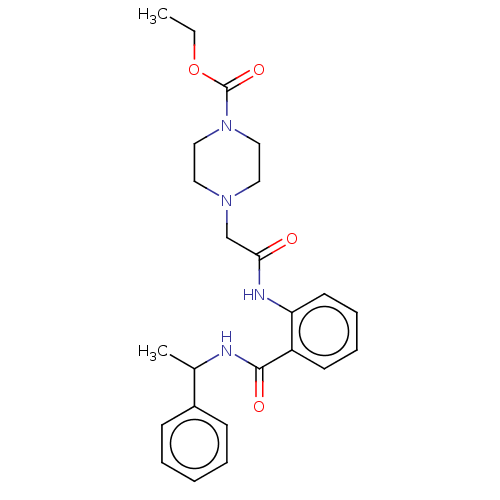
Affinity DataIC50: 2.64nMAssay Description:The studies began by screening for the optimal protein concentrations for the method. The studies were conducted in goat anti-mouse IgG coated black ...More data for this Ligand-Target Pair

Affinity DataIC50: 2.80nMAssay Description:The studies began by screening for the optimal protein concentrations for the method. The studies were conducted in goat anti-mouse IgG coated black ...More data for this Ligand-Target Pair

Affinity DataIC50: 4.67nMAssay Description:The studies began by screening for the optimal protein concentrations for the method. The studies were conducted in goat anti-mouse IgG coated black ...More data for this Ligand-Target Pair
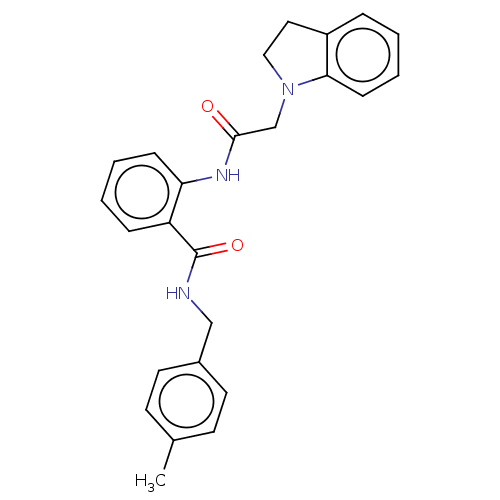
Affinity DataIC50: 19.2nMAssay Description:The studies began by screening for the optimal protein concentrations for the method. The studies were conducted in goat anti-mouse IgG coated black ...More data for this Ligand-Target Pair