5IX0

HDAC2 WITH LIGAND BRD7232


Experimental Data Snapshot

  • Method: X-RAY DIFFRACTION
  • Resolution: 1.72 Å
  • R-Value Free: 0.200 
  • R-Value Work: 0.180 
  • R-Value Observed: 0.180 

wwPDB Validation   3D Report Full Report


Ligand Structure Quality Assessment 


This is version 1.1 of the entry. See complete history


Literature

Kinetic and structural insights into the binding of histone deacetylase 1 and 2 (HDAC1, 2) inhibitors.

Wagner, F.F.Weiwer, M.Steinbacher, S.Schomburg, A.Reinemer, P.Gale, J.P.Campbell, A.J.Fisher, S.L.Zhao, W.N.Reis, S.A.Hennig, K.M.Thomas, M.Muller, P.Jefson, M.R.Fass, D.M.Haggarty, S.J.Zhang, Y.L.Holson, E.B.

(2016) Bioorg Med Chem 24: 4008-4015

  • DOI: https://doi.org/10.1016/j.bmc.2016.06.040
  • Primary Citation of Related Structures:  
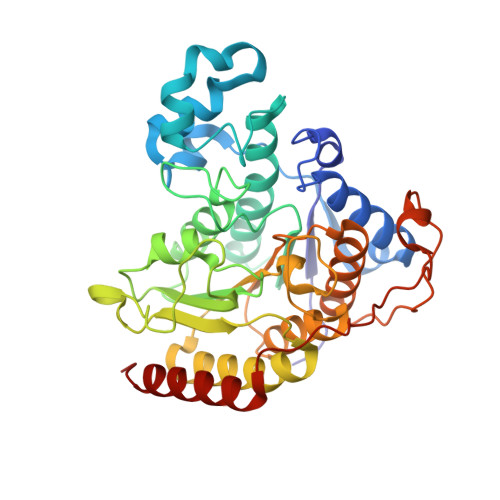
    5IWG, 5IX0

  • PubMed Abstract: 

    The structure-activity and structure-kinetic relationships of a series of novel and selective ortho-aminoanilide inhibitors of histone deacetylases (HDACs) 1 and 2 are described. Different kinetic and thermodynamic selectivity profiles were obtained by varying the moiety occupying an 11Å channel leading to the Zn(2+) catalytic pocket of HDACs 1 and 2, two paralogs with a high degree of structural similarity. The design of these novel inhibitors was informed by two ligand-bound crystal structures of truncated hHDAC2. BRD4884 and BRD7232 possess kinetic selectivity for HDAC1 versus HDAC2. We demonstrate that the binding kinetics of HDAC inhibitors can be tuned for individual isoforms in order to modulate target residence time while retaining functional activity and increased histone H4K12 and H3K9 acetylation in primary mouse neuronal cell culture assays. These chromatin modifiers, with tuned binding kinetic profiles, can be used to define the relation between target engagement requirements and the pharmacodynamic response of HDACs in different disease applications.


  • Organizational Affiliation

    Stanley Center for Psychiatric Research, Broad Institute of MIT and Harvard, 75 Ames Street, Cambridge, MA, USA. Electronic address: fwagner@broadinstitute.org.


Macromolecules
Find similar proteins by:  (by identity cutoff)  |  3D Structure
Entity ID: 1
MoleculeChains Sequence LengthOrganismDetailsImage
Histone deacetylase 2
A, B, C
369Homo sapiensMutation(s): 0 
Gene Names: HDAC2
EC: 3.5.1.98
UniProt & NIH Common Fund Data Resources
Find proteins for Q92769 (Homo sapiens)
Explore Q92769 
Go to UniProtKB:  Q92769
PHAROS:  Q92769
GTEx:  ENSG00000196591 
Entity Groups  
Sequence Clusters30% Identity50% Identity70% Identity90% Identity95% Identity100% Identity
UniProt GroupQ92769
Sequence Annotations
Expand
  • Reference Sequence
Small Molecules
Ligands 8 Unique
IDChains Name / Formula / InChI Key2D Diagram3D Interactions
6EZ
Query on 6EZ

Download Ideal Coordinates CCD File 
EA [auth C],
G [auth A],
Q [auth B]
(3-exo)-N-(4-amino-4'-fluoro[1,1'-biphenyl]-3-yl)-8-oxabicyclo[3.2.1]octane-3-carboxamide
C20 H21 F N2 O2
SBKJRDAJADZOCH-XGBSXSJOSA-N
PG4
Query on PG4

Download Ideal Coordinates CCD File 
HA [auth C],
J [auth A]
TETRAETHYLENE GLYCOL
C8 H18 O5
UWHCKJMYHZGTIT-UHFFFAOYSA-N
PG5
Query on PG5

Download Ideal Coordinates CCD File 
K [auth A],
U [auth B],
V [auth B]
1-METHOXY-2-[2-(2-METHOXY-ETHOXY]-ETHANE
C8 H18 O4
YFNKIDBQEZZDLK-UHFFFAOYSA-N
PGE
Query on PGE

Download Ideal Coordinates CCD File 
AA [auth B]
IA [auth C]
JA [auth C]
L [auth A]
M [auth A]
AA [auth B],
IA [auth C],
JA [auth C],
L [auth A],
M [auth A],
W [auth B],
X [auth B],
Y [auth B],
Z [auth B]
TRIETHYLENE GLYCOL
C6 H14 O4
ZIBGPFATKBEMQZ-UHFFFAOYSA-N
PEG
Query on PEG

Download Ideal Coordinates CCD File 
GA [auth C],
H [auth A],
I [auth A],
S [auth B],
T [auth B]
DI(HYDROXYETHYL)ETHER
C4 H10 O3
MTHSVFCYNBDYFN-UHFFFAOYSA-N
ZN
Query on ZN

Download Ideal Coordinates CCD File 
BA [auth C],
D [auth A],
N [auth B]
ZINC ION
Zn
PTFCDOFLOPIGGS-UHFFFAOYSA-N
EDO
Query on EDO

Download Ideal Coordinates CCD File 
FA [auth C],
R [auth B]
1,2-ETHANEDIOL
C2 H6 O2
LYCAIKOWRPUZTN-UHFFFAOYSA-N
CA
Query on CA

Download Ideal Coordinates CCD File 
CA [auth C]
DA [auth C]
E [auth A]
F [auth A]
O [auth B]
CA [auth C],
DA [auth C],
E [auth A],
F [auth A],
O [auth B],
P [auth B]
CALCIUM ION
Ca
BHPQYMZQTOCNFJ-UHFFFAOYSA-N
Binding Affinity Annotations 
IDSourceBinding Affinity
6EZ BindingDB:  5IX0 Ki: min: 176, max: 519 (nM) from 2 assay(s)
IC50: min: 168, max: 192 (nM) from 2 assay(s)
Binding MOAD:  5IX0 Ki: 519 (nM) from 1 assay(s)
Experimental Data & Validation

Experimental Data

  • Method: X-RAY DIFFRACTION
  • Resolution: 1.72 Å
  • R-Value Free: 0.200 
  • R-Value Work: 0.180 
  • R-Value Observed: 0.180 
  • Space Group: P 21 21 21
Unit Cell:
Length ( Å )Angle ( ˚ )
a = 92.195α = 90
b = 97.473β = 90
c = 139.254γ = 90
Software Package:
Software NamePurpose
XDSdata reduction
XSCALEdata scaling
REFMACrefinement
MOLREPphasing

Structure Validation

View Full Validation Report


Ligand Structure Quality Assessment 


Entry History 

Deposition Data

Revision History  (Full details and data files)

  • Version 1.0: 2016-08-31
    Type: Initial release
  • Version 1.1: 2024-03-06
    Changes: Data collection, Database references, Derived calculations