 Found 18 of ph data with Target = 'Peroxisome proliferator-activated receptor delta'
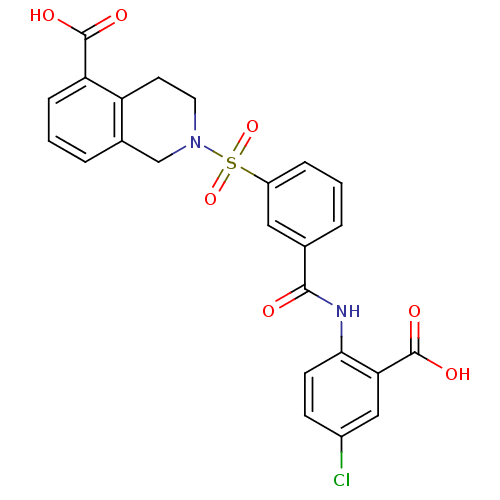
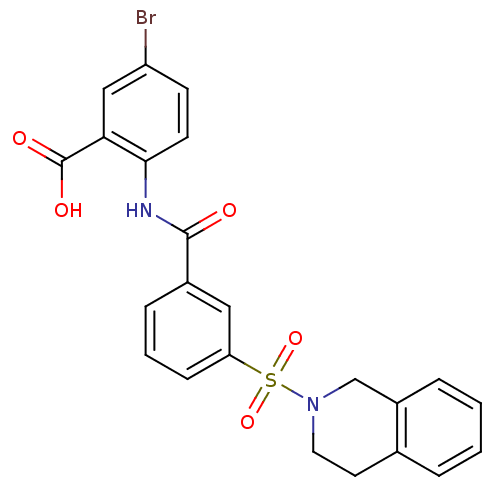
Affinity DataIC50: 4nM EC50: 1.26E+3nMpH: 7.0 T: 2°CAssay Description:Competition-binding curves for test compounds were determined with expressed human PPAR LBD. Plots of inhibitor concentration versus cpm of radioliga...More data for this Ligand-Target Pair
Affinity DataIC50: 5nM EC50: 3nMpH: 7.0 T: 2°CAssay Description:Competition-binding curves for test compounds were determined with expressed human PPAR LBD. Plots of inhibitor concentration versus cpm of radioliga...More data for this Ligand-Target Pair
 3D Structure (crystal)
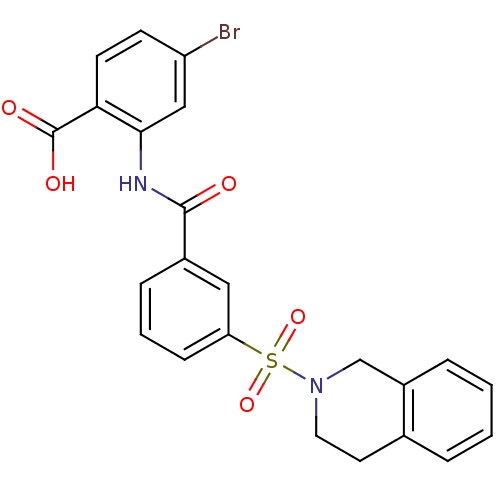
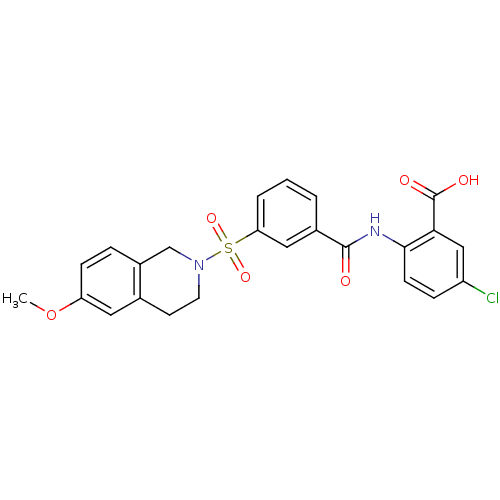
Affinity DataIC50: 5nM EC50: 158nMpH: 7.0 T: 2°CAssay Description:Competition-binding curves for test compounds were determined with expressed human PPAR LBD. Plots of inhibitor concentration versus cpm of radioliga...More data for this Ligand-Target Pair
Affinity DataIC50: 5nM EC50: 158nMpH: 7.0 T: 2°CAssay Description:Competition-binding curves for test compounds were determined with expressed human PPAR LBD. Plots of inhibitor concentration versus cpm of radioliga...More data for this Ligand-Target Pair

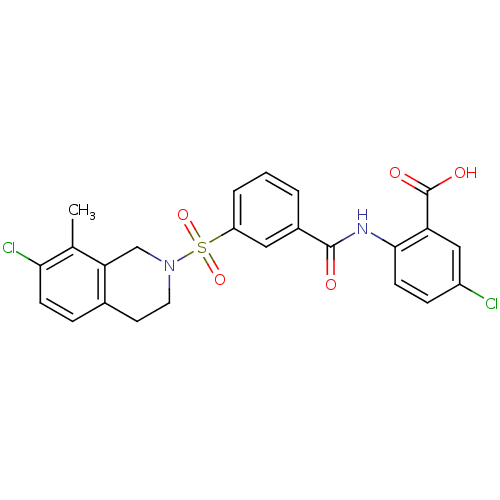
Affinity DataIC50: 8nM EC50: 126nMpH: 7.0 T: 2°CAssay Description:Competition-binding curves for test compounds were determined with expressed human PPAR LBD. Plots of inhibitor concentration versus cpm of radioliga...More data for this Ligand-Target Pair
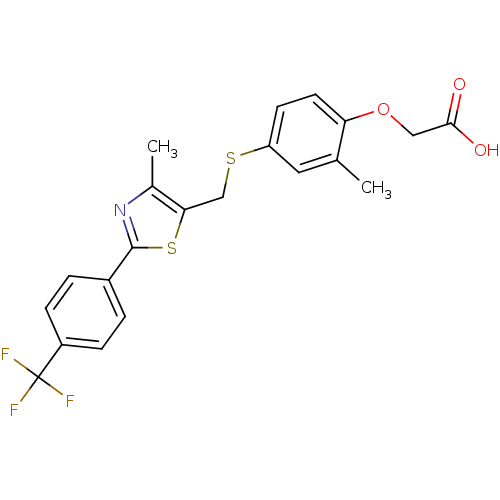
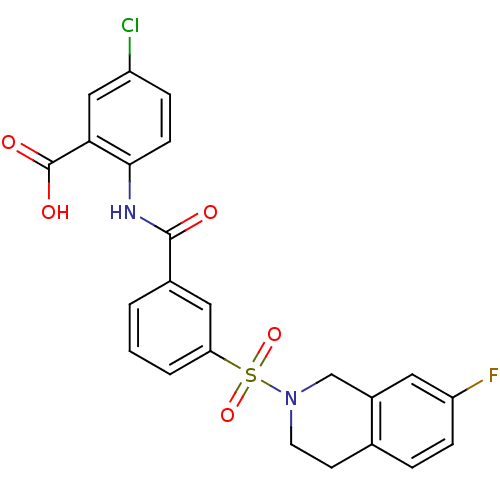
Affinity DataIC50: 8nM EC50: 200nMpH: 7.0 T: 2°CAssay Description:Competition-binding curves for test compounds were determined with expressed human PPAR LBD. Plots of inhibitor concentration versus cpm of radioliga...More data for this Ligand-Target Pair

Affinity DataIC50: 10nM EC50: >1.00E+4nMpH: 7.0 T: 2°CAssay Description:Competition-binding curves for test compounds were determined with expressed human PPAR LBD. Plots of inhibitor concentration versus cpm of radioliga...More data for this Ligand-Target Pair
Affinity DataIC50: 10nM EC50: 794nMpH: 7.0 T: 2°CAssay Description:Competition-binding curves for test compounds were determined with expressed human PPAR LBD. Plots of inhibitor concentration versus cpm of radioliga...More data for this Ligand-Target Pair

Affinity DataIC50: 13nM EC50: 1.26E+3nMpH: 7.0 T: 2°CAssay Description:Competition-binding curves for test compounds were determined with expressed human PPAR LBD. Plots of inhibitor concentration versus cpm of radioliga...More data for this Ligand-Target Pair

Affinity DataIC50: 13nM EC50: 200nMpH: 7.0 T: 2°CAssay Description:Competition-binding curves for test compounds were determined with expressed human PPAR LBD. Plots of inhibitor concentration versus cpm of radioliga...More data for this Ligand-Target Pair
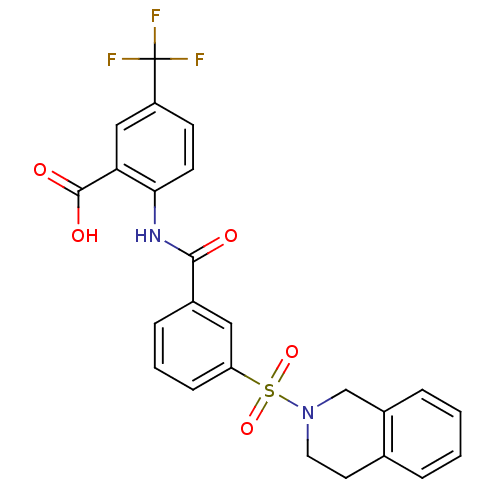
Affinity DataIC50: 16nM EC50: 316nMpH: 7.0 T: 2°CAssay Description:Competition-binding curves for test compounds were determined with expressed human PPAR LBD. Plots of inhibitor concentration versus cpm of radioliga...More data for this Ligand-Target Pair
Affinity DataIC50: 16nM EC50: 1.00E+3nMpH: 7.0 T: 2°CAssay Description:Competition-binding curves for test compounds were determined with expressed human PPAR LBD. Plots of inhibitor concentration versus cpm of radioliga...More data for this Ligand-Target Pair
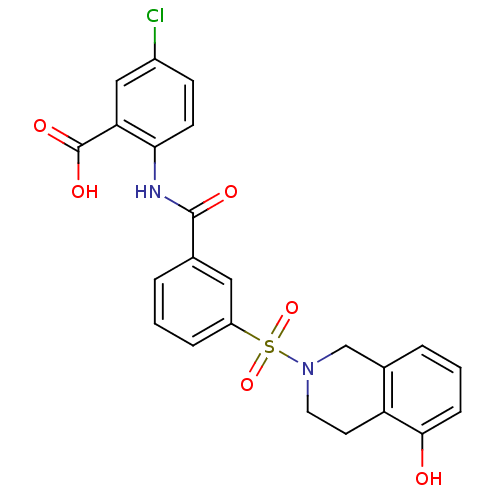
Affinity DataIC50: 20nM EC50: 2.00E+3nMpH: 7.0 T: 2°CAssay Description:Competition-binding curves for test compounds were determined with expressed human PPAR LBD. Plots of inhibitor concentration versus cpm of radioliga...More data for this Ligand-Target Pair

Affinity DataIC50: 25nM EC50: 501nMpH: 7.0 T: 2°CAssay Description:Competition-binding curves for test compounds were determined with expressed human PPAR LBD. Plots of inhibitor concentration versus cpm of radioliga...More data for this Ligand-Target Pair
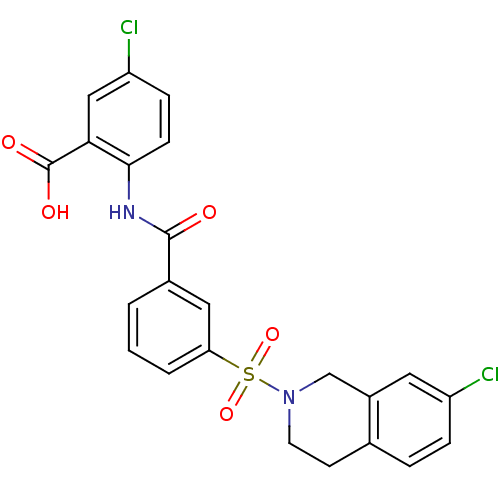
Affinity DataIC50: 25nM EC50: 794nMpH: 7.0 T: 2°CAssay Description:Competition-binding curves for test compounds were determined with expressed human PPAR LBD. Plots of inhibitor concentration versus cpm of radioliga...More data for this Ligand-Target Pair
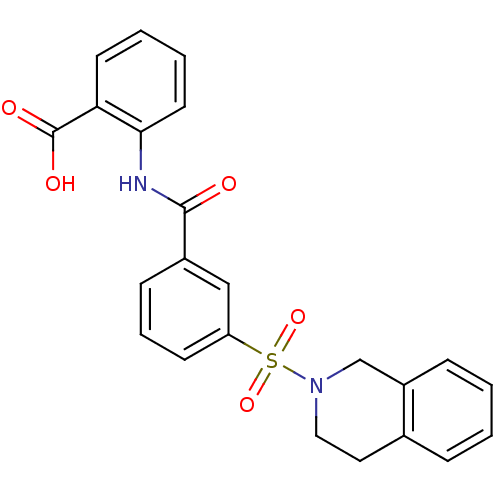
Affinity DataIC50: 126nM EC50: 1.26E+3nMpH: 7.0 T: 2°CAssay Description:Competition-binding curves for test compounds were determined with expressed human PPAR LBD. Plots of inhibitor concentration versus cpm of radioliga...More data for this Ligand-Target Pair

Affinity DataIC50: >1.00E+4nM EC50: >1.00E+4nMpH: 7.0 T: 2°CAssay Description:Competition-binding curves for test compounds were determined with expressed human PPAR LBD. Plots of inhibitor concentration versus cpm of radioliga...More data for this Ligand-Target Pair
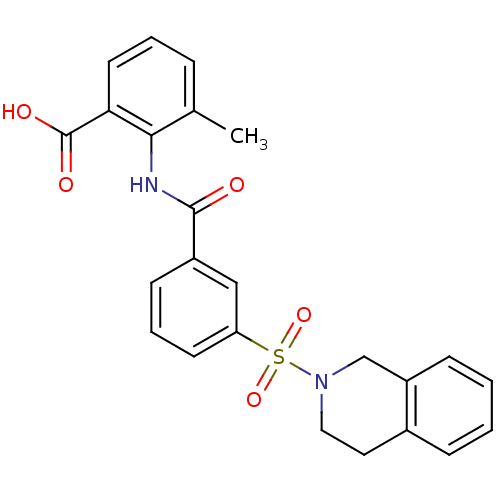
Affinity DataIC50: >1.00E+4nM EC50: >1.00E+4nMpH: 7.0 T: 2°CAssay Description:Competition-binding curves for test compounds were determined with expressed human PPAR LBD. Plots of inhibitor concentration versus cpm of radioliga...More data for this Ligand-Target Pair