 Found 201 with Last Name = 'gao' and Initial = 'e'
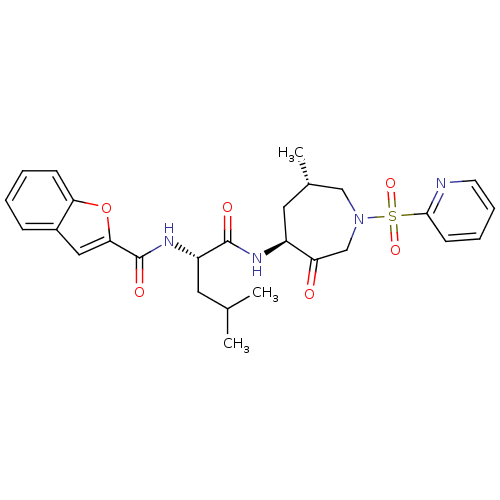
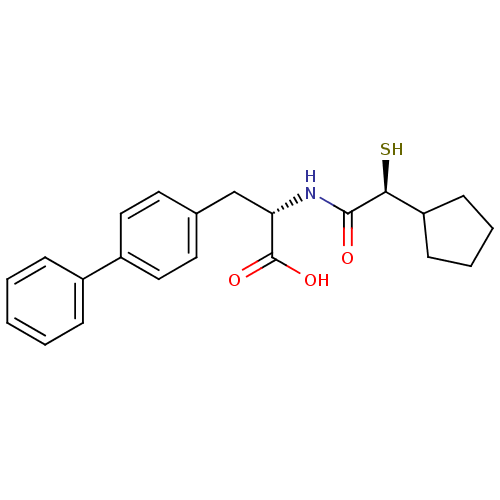
Affinity DataKi: 0.00990nM ΔG°: -62.2kJ/molepH: 5.5 T: 2°CAssay Description:Potential inhibitors were evaluated using the progress curve method. Assays were carried out in the presence of variable concentrations of test compo...More data for this Ligand-Target Pair
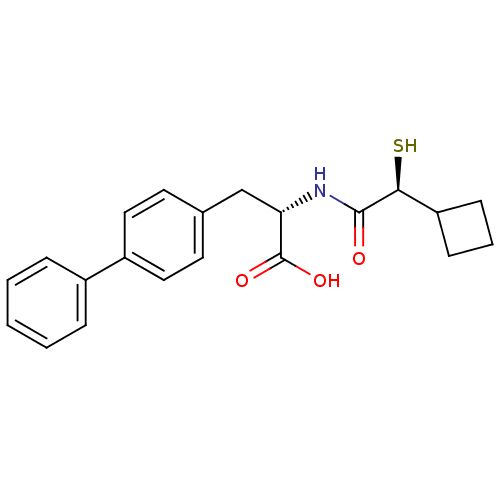
Affinity DataKi: 0.0400nM ΔG°: -58.8kJ/molepH: 5.5 T: 2°CAssay Description:Potential inhibitors were evaluated using the progress curve method. Assays were carried out in the presence of variable concentrations of test compo...More data for this Ligand-Target Pair

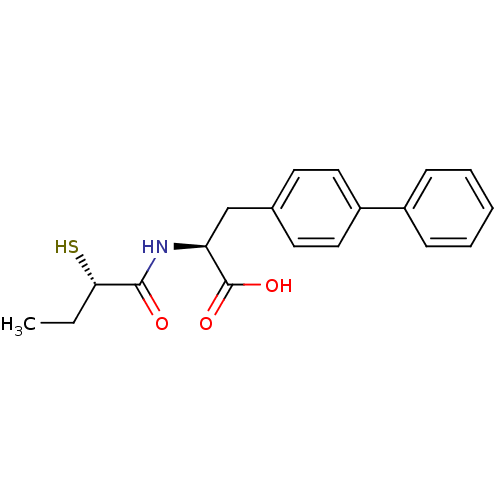
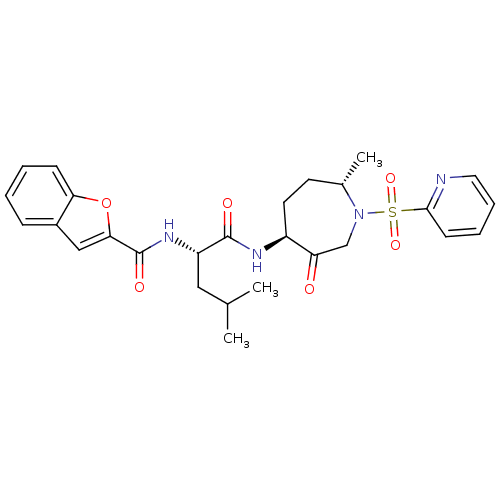
Affinity DataKi: 0.0410nM ΔG°: -58.7kJ/molepH: 5.5 T: 2°CAssay Description:Potential inhibitors were evaluated using the progress curve method. Assays were carried out in the presence of variable concentrations of test compo...More data for this Ligand-Target Pair
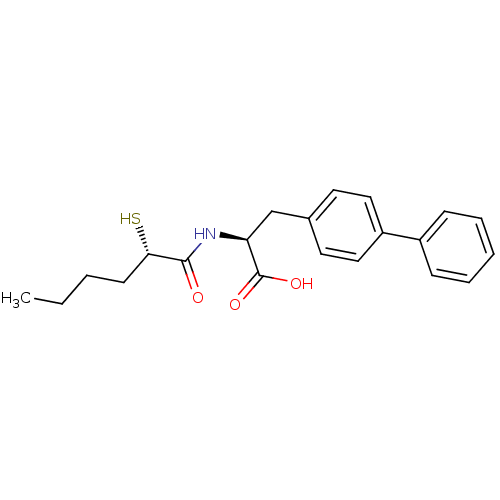
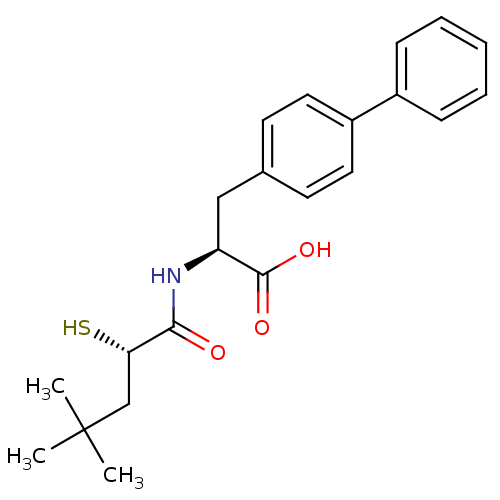
Affinity DataKi: 0.0630nMAssay Description:Potential inhibitors were evaluated using the progress curve method. Assays were carried out in the presence of variable concentrations of test compo...More data for this Ligand-Target Pair
Affinity DataKi: 0.0680nM ΔG°: -57.4kJ/molepH: 5.5 T: 2°CAssay Description:Potential inhibitors were evaluated using the progress curve method. Assays were carried out in the presence of variable concentrations of test compo...More data for this Ligand-Target Pair
Affinity DataKi: 0.140nM ΔG°: -55.7kJ/molepH: 5.5 T: 2°CAssay Description:Potential inhibitors were evaluated using the progress curve method. Assays were carried out in the presence of variable concentrations of test compo...More data for this Ligand-Target Pair

Affinity DataKi: 0.160nM ΔG°: -55.3kJ/molepH: 5.5 T: 2°CAssay Description:Potential inhibitors were evaluated using the progress curve method. Assays were carried out in the presence of variable concentrations of test compo...More data for this Ligand-Target Pair
 3D Structure (crystal)
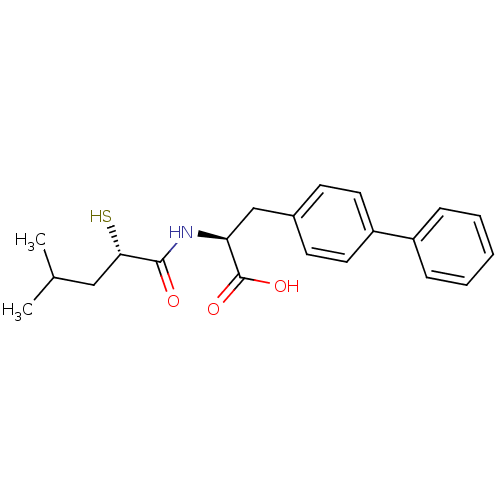
Affinity DataKi: 0.280nMAssay Description:Inhibition of human recombinant NEP by fluorescence assayMore data for this Ligand-Target Pair
Affinity DataKi: 0.630nM ΔG°: -52.0kJ/molepH: 5.5 T: 2°CAssay Description:Potential inhibitors were evaluated using the progress curve method. Assays were carried out in the presence of variable concentrations of test compo...More data for this Ligand-Target Pair
Affinity DataKi: 0.800nMAssay Description:Inhibition of human recombinant NEP by fluorescence assayMore data for this Ligand-Target Pair

Affinity DataKi: 1.10nMAssay Description:Inhibition of human recombinant NEP by fluorescence assayMore data for this Ligand-Target Pair
Affinity DataKi: 1.20nMAssay Description:Inhibition of human recombinant NEP by fluorescence assayMore data for this Ligand-Target Pair
Affinity DataKi: 1.30nMAssay Description:Inhibition of human recombinant NEP by fluorescence assayMore data for this Ligand-Target Pair
Affinity DataKi: 1.40nMAssay Description:Inhibition of human recombinant ACE2 by fluorescence assayMore data for this Ligand-Target Pair
Affinity DataKi: 1.40nMAssay Description:Inhibition of human recombinant ACE2 by fluorescence assayMore data for this Ligand-Target Pair

Affinity DataKi: 1.40nM ΔG°: -50.0kJ/molepH: 5.5 T: 2°CAssay Description:Potential inhibitors were evaluated using the progress curve method. Assays were carried out in the presence of variable concentrations of test compo...More data for this Ligand-Target Pair
Affinity DataKi: 1.5nMAssay Description:Inhibition of human recombinant ACE2 by fluorescence assayMore data for this Ligand-Target Pair

Affinity DataKi: 1.5nMAssay Description:Inhibition of human recombinant ACE2 by fluorescence assayMore data for this Ligand-Target Pair
Affinity DataKi: 1.5nM ΔG°: -49.9kJ/molepH: 5.5 T: 2°CAssay Description:Potential inhibitors were evaluated using the progress curve method. Assays were carried out in the presence of variable concentrations of test compo...More data for this Ligand-Target Pair
Affinity DataKi: 1.60nMAssay Description:Potential inhibitors were evaluated using the progress curve method. Assays were carried out in the presence of variable concentrations of test compo...More data for this Ligand-Target Pair
Affinity DataKi: 1.60nMAssay Description:Inhibition of human recombinant ACE2 by fluorescence assayMore data for this Ligand-Target Pair
Affinity DataKi: 1.80nMAssay Description:Potential inhibitors were evaluated using the progress curve method. Assays were carried out in the presence of variable concentrations of test compo...More data for this Ligand-Target Pair
Affinity DataKi: 1.80nMAssay Description:Inhibition of human recombinant ACE2 by fluorescence assayMore data for this Ligand-Target Pair
Affinity DataKi: 1.80nMAssay Description:Inhibition of human recombinant ACE2 by fluorescence assayMore data for this Ligand-Target Pair
Affinity DataKi: 2.20nM ΔG°: -48.9kJ/molepH: 5.5 T: 2°CAssay Description:Potential inhibitors were evaluated using the progress curve method. Assays were carried out in the presence of variable concentrations of test compo...More data for this Ligand-Target Pair
Affinity DataKi: 2.40nMAssay Description:Inhibition of human recombinant ACE2 by fluorescence assayMore data for this Ligand-Target Pair
Affinity DataKi: 2.40nMAssay Description:Inhibition of human recombinant NEP by fluorescence assayMore data for this Ligand-Target Pair
Affinity DataKi: 2.5nM ΔG°: -48.6kJ/molepH: 5.5 T: 2°CAssay Description:Potential inhibitors were evaluated using the progress curve method. Assays were carried out in the presence of variable concentrations of test compo...More data for this Ligand-Target Pair
Affinity DataKi: 2.60nMAssay Description:Inhibition of human recombinant NEP by fluorescence assayMore data for this Ligand-Target Pair
Affinity DataKi: 2.60nMAssay Description:Inhibition of human recombinant NEP by fluorescence assayMore data for this Ligand-Target Pair
Affinity DataKi: 3.20nMAssay Description:Inhibition of human recombinant ACE by fluorescence assayMore data for this Ligand-Target Pair
Affinity DataKi: 3.90nM ΔG°: -47.5kJ/molepH: 5.5 T: 2°CAssay Description:Potential inhibitors were evaluated using the progress curve method. Assays were carried out in the presence of variable concentrations of test compo...More data for this Ligand-Target Pair
Affinity DataKi: 4nMAssay Description:Potential inhibitors were evaluated using the progress curve method. Assays were carried out in the presence of variable concentrations of test compo...More data for this Ligand-Target Pair
Affinity DataKi: 4nM ΔG°: -47.5kJ/molepH: 5.5 T: 2°CAssay Description:Potential inhibitors were evaluated using the progress curve method. Assays were carried out in the presence of variable concentrations of test compo...More data for this Ligand-Target Pair
Affinity DataKi: 4.20nM ΔG°: -47.3kJ/molepH: 5.5 T: 2°CAssay Description:Potential inhibitors were evaluated using the progress curve method. Assays were carried out in the presence of variable concentrations of test compo...More data for this Ligand-Target Pair
Affinity DataKi: 4.5nM ΔG°: -47.2kJ/molepH: 5.5 T: 2°CAssay Description:Potential inhibitors were evaluated using the progress curve method. Assays were carried out in the presence of variable concentrations of test compo...More data for this Ligand-Target Pair

Affinity DataKi: 4.5nM ΔG°: -47.2kJ/molepH: 5.5 T: 2°CAssay Description:Potential inhibitors were evaluated using the progress curve method. Assays were carried out in the presence of variable concentrations of test compo...More data for this Ligand-Target Pair
Affinity DataKi: 5.40nMAssay Description:Inhibition of human recombinant NEP by fluorescence assayMore data for this Ligand-Target Pair
Affinity DataKi: 5.80nMAssay Description:Potential inhibitors were evaluated using the progress curve method. Assays were carried out in the presence of variable concentrations of test compo...More data for this Ligand-Target Pair
Affinity DataKi: 6.90nMAssay Description:Inhibition of human recombinant ACE2 by fluorescence assayMore data for this Ligand-Target Pair
Affinity DataKi: 7.10nMAssay Description:Inhibition of human recombinant ACE2 by fluorescence assayMore data for this Ligand-Target Pair
Affinity DataKi: 7.90nM ΔG°: -45.8kJ/molepH: 5.5 T: 2°CAssay Description:Potential inhibitors were evaluated using the progress curve method. Assays were carried out in the presence of variable concentrations of test compo...More data for this Ligand-Target Pair
Affinity DataKi: 8nMAssay Description:Potential inhibitors were evaluated using the progress curve method. Assays were carried out in the presence of variable concentrations of test compo...More data for this Ligand-Target Pair
Affinity DataKi: 8.30nMAssay Description:Potential inhibitors were evaluated using the progress curve method. Assays were carried out in the presence of variable concentrations of test compo...More data for this Ligand-Target Pair
Affinity DataKi: 8.60nMAssay Description:Inhibition of human recombinant ACE by fluorescence assayMore data for this Ligand-Target Pair
Affinity DataKi: 9.30nMAssay Description:Inhibition of human recombinant ACE by fluorescence assayMore data for this Ligand-Target Pair
Affinity DataKi: 10nM ΔG°: -45.2kJ/molepH: 5.5 T: 2°CAssay Description:Potential inhibitors were evaluated using the progress curve method. Assays were carried out in the presence of variable concentrations of test compo...More data for this Ligand-Target Pair
Affinity DataKi: 13nMAssay Description:Inhibition of human recombinant NEP by fluorescence assayMore data for this Ligand-Target Pair
Affinity DataKi: 13nMAssay Description:Potential inhibitors were evaluated using the progress curve method. Assays were carried out in the presence of variable concentrations of test compo...More data for this Ligand-Target Pair
Affinity DataKi: 13nMAssay Description:Inhibition of human recombinant NEP by fluorescence assayMore data for this Ligand-Target Pair