 Found 291 with Last Name = 'baumann' and Initial = 'a'
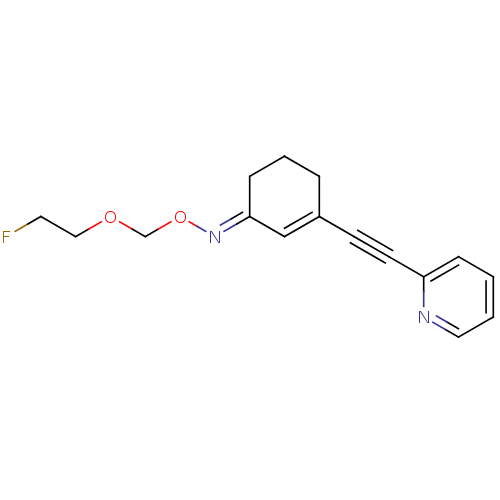
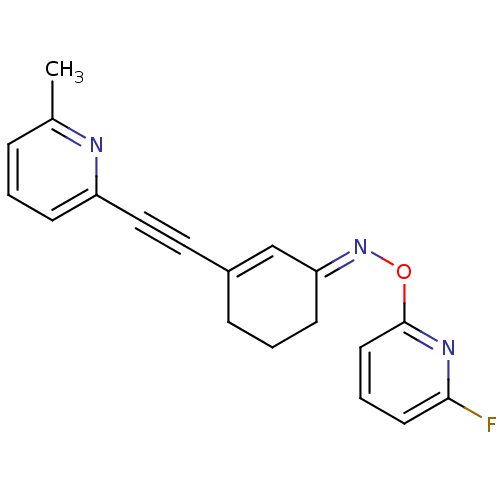
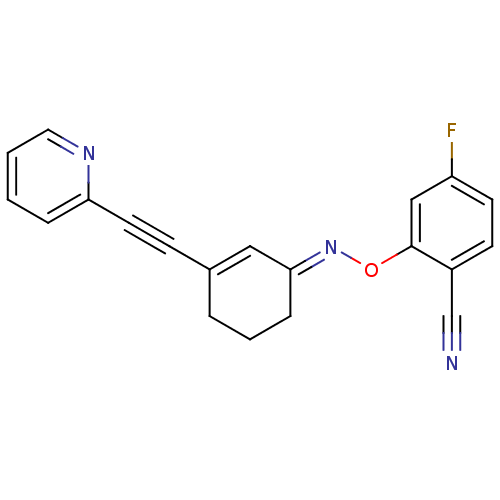
Affinity DataKi: 2.20nMAssay Description:Displacement of [3H]M-MPEP from mGluR5 in Sprague-Dawley rat brain P2 membrane after 45 mins by beta countingMore data for this Ligand-Target Pair
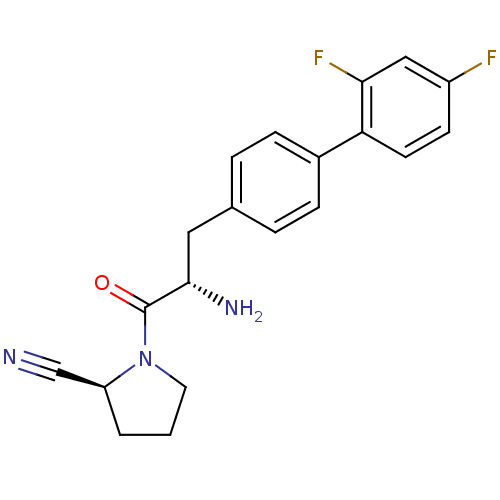
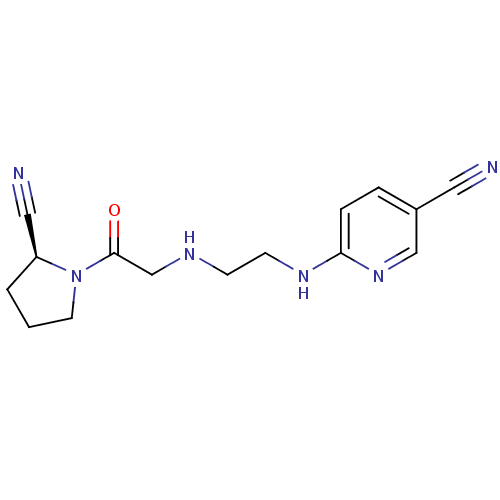
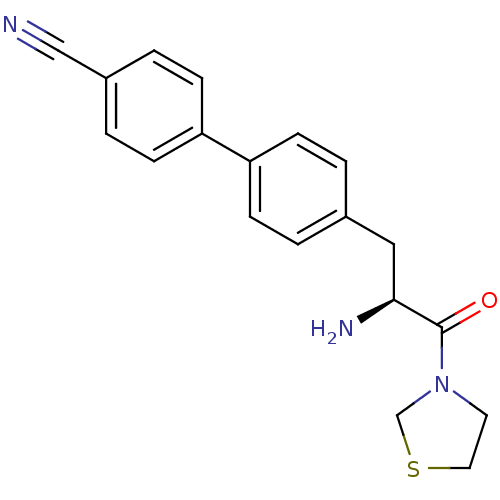
Affinity DataKi: 2.20nM ΔG°: -49.4kJ/molepH: 7.4 T: 2°CAssay Description:The progress of DPPIV inhibition by compounds was measured by recording the liberation of free pNA at 405 nm. IC50 was determined from the slope of r...More data for this Ligand-Target Pair
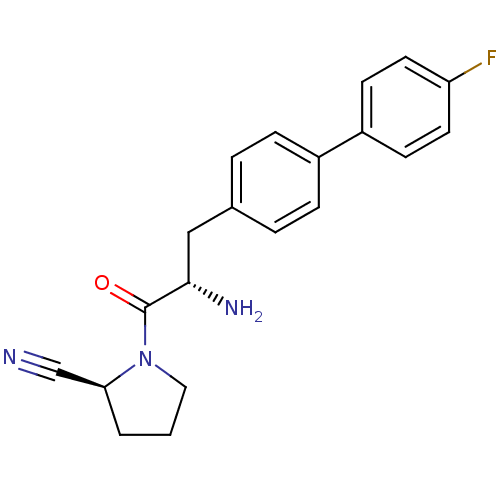
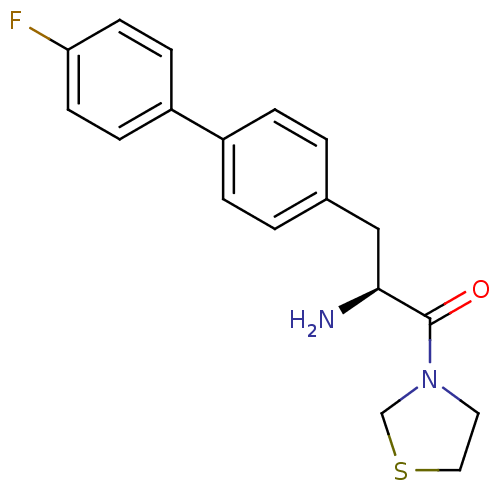
Affinity DataKi: 3.10nM ΔG°: -48.6kJ/molepH: 7.4 T: 2°CAssay Description:The progress of DPPIV inhibition by compounds was measured by recording the liberation of free pNA at 405 nm. IC50 was determined from the slope of r...More data for this Ligand-Target Pair

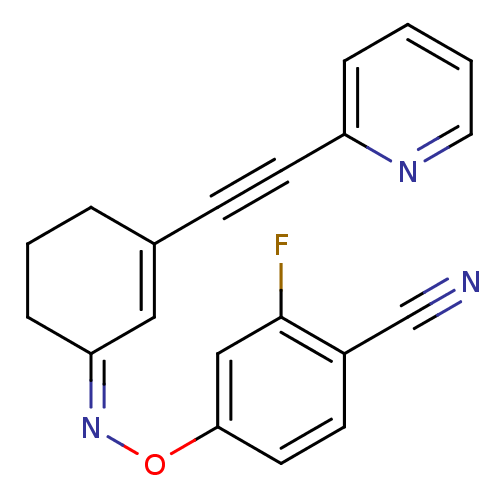
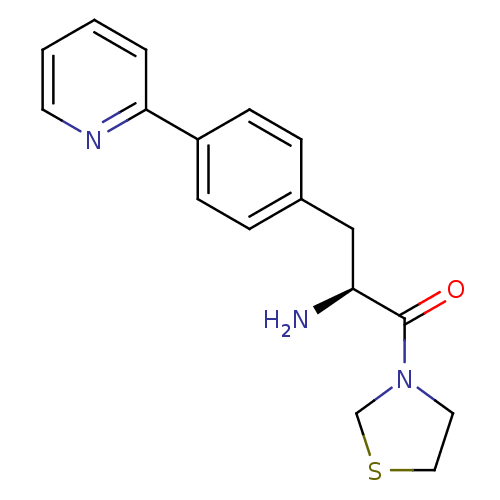
Affinity DataKi: 3.80nMAssay Description:Displacement of [3H]M-MPEP from mGluR5 in Sprague-Dawley rat brain P2 membrane after 45 mins by beta countingMore data for this Ligand-Target Pair

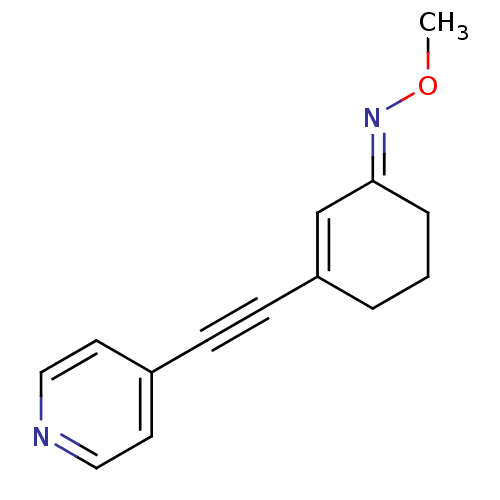
Affinity DataKi: 4.01nMAssay Description:Displacement of [3H]M-MPEP from mGluR5 in Sprague-Dawley rat brain P2 membrane after 45 mins by beta countingMore data for this Ligand-Target Pair

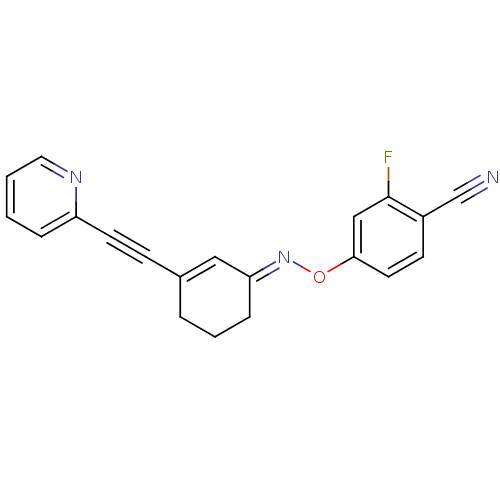
Affinity DataKi: 4.40nMAssay Description:Displacement of [3H]M-MPEP from mGluR5 in Sprague-Dawley rat brain P2 membrane after 45 mins by beta countingMore data for this Ligand-Target Pair
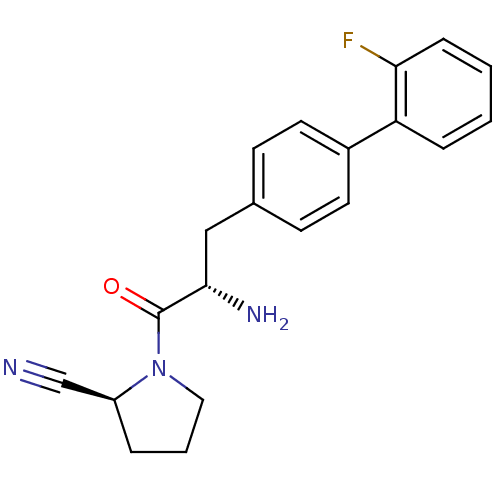
Affinity DataKi: 5.30nM ΔG°: -47.2kJ/molepH: 7.4 T: 2°CAssay Description:The progress of DPPIV inhibition by compounds was measured by recording the liberation of free pNA at 405 nm. IC50 was determined from the slope of r...More data for this Ligand-Target Pair

Affinity DataKi: 5.42nMAssay Description:Displacement of [3H]M-MPEP from mGluR5 in Sprague-Dawley rat brain P2 membrane after 45 mins by beta countingMore data for this Ligand-Target Pair

Affinity DataKi: 5.5nMAssay Description:Displacement of [3H]M-MPEP from mGluR5 in Sprague-Dawley rat cerebellum membranes after 45 mins by liquid scintillation countingMore data for this Ligand-Target Pair
Affinity DataKi: 8.41nMAssay Description:Displacement of [3H]M-MPEP from mGluR5 in Sprague-Dawley rat brain P2 membrane after 45 mins by beta countingMore data for this Ligand-Target Pair
Affinity DataKi: 9.15nMAssay Description:Displacement of [3H]M-MPEP from mGluR5 in Sprague-Dawley rat brain P2 membrane after 45 mins by beta countingMore data for this Ligand-Target Pair

Affinity DataKi: 13nM ΔG°: -45.0kJ/molepH: 7.4 T: 2°CAssay Description:The progress of DPPIV inhibition by compounds was measured by recording the liberation of free pNA at 405 nm. IC50 was determined from the slope of r...More data for this Ligand-Target Pair
Affinity DataKi: 20nM ΔG°: -43.9kJ/molepH: 7.4 T: 2°CAssay Description:The progress of DPPIV inhibition by compounds was measured by recording the liberation of free pNA at 405 nm. IC50 was determined from the slope of r...More data for this Ligand-Target Pair
Affinity DataKi: 20.3nMAssay Description:Displacement of [3H]M-MPEP from mGluR5 in Sprague-Dawley rat cerebellum membranes after 45 mins by liquid scintillation countingMore data for this Ligand-Target Pair
Affinity DataKi: 21.9nMAssay Description:Displacement of [3H]M-MPEP from mGluR5 in Sprague-Dawley rat cerebellum membranes after 45 mins by liquid scintillation countingMore data for this Ligand-Target Pair

Affinity DataKi: 26nM ΔG°: -43.3kJ/molepH: 7.4 T: 2°CAssay Description:The progress of DPPIV inhibition by compounds was measured by recording the liberation of free pNA at 405 nm. IC50 was determined from the slope of r...More data for this Ligand-Target Pair

Affinity DataKi: 26.8nMAssay Description:Displacement of [3H]M-MPEP from mGluR5 in Sprague-Dawley rat brain P2 membrane after 45 mins by beta countingMore data for this Ligand-Target Pair
Affinity DataKi: 27nM ΔG°: -43.2kJ/molepH: 7.4 T: 2°CAssay Description:The progress of DPPIV inhibition by compounds was measured by recording the liberation of free pNA at 405 nm. IC50 was determined from the slope of r...More data for this Ligand-Target Pair
Affinity DataKi: 34nM ΔG°: -42.6kJ/molepH: 7.4 T: 2°CAssay Description:The progress of DPPIV inhibition by compounds was measured by recording the liberation of free pNA at 405 nm. IC50 was determined from the slope of r...More data for this Ligand-Target Pair

Affinity DataKi: 36nMAssay Description:Displacement of [3H]M-MPEP from mGluR5 in Sprague-Dawley rat cerebellum membranes after 45 mins by liquid scintillation countingMore data for this Ligand-Target Pair
Affinity DataKi: 36nM ΔG°: -42.5kJ/molepH: 7.4 T: 2°CAssay Description:The progress of DPPIV inhibition by compounds was measured by recording the liberation of free pNA at 405 nm. IC50 was determined from the slope of r...More data for this Ligand-Target Pair
Affinity DataKi: 44.0nMAssay Description:Displacement of [3H]M-MPEP from mGluR5 in Sprague-Dawley rat brain P2 membrane after 45 mins by beta countingMore data for this Ligand-Target Pair
Affinity DataKi: 46.8nMAssay Description:Displacement of [3H]M-MPEP from mGluR5 in Sprague-Dawley rat brain P2 membrane after 45 mins by beta countingMore data for this Ligand-Target Pair
Affinity DataKi: 49.8nMAssay Description:Displacement of [3H]M-MPEP from mGluR5 in Sprague-Dawley rat brain P2 membrane after 45 mins by beta countingMore data for this Ligand-Target Pair
Affinity DataKi: 54.8nMAssay Description:Displacement of [3H]M-MPEP from mGluR5 in Sprague-Dawley rat brain P2 membrane after 45 mins by beta countingMore data for this Ligand-Target Pair
Affinity DataKi: 56.1nMAssay Description:Displacement of [3H]M-MPEP from mGluR5 in Sprague-Dawley rat brain P2 membrane after 45 mins by beta countingMore data for this Ligand-Target Pair

Affinity DataKi: 63nM ΔG°: -41.1kJ/molepH: 7.4 T: 2°CAssay Description:The progress of DPPIV inhibition by compounds was measured by recording the liberation of free pNA at 405 nm. IC50 was determined from the slope of r...More data for this Ligand-Target Pair
Affinity DataKi: 73.4nMAssay Description:Displacement of [3H]M-MPEP from mGluR5 in Sprague-Dawley rat brain P2 membrane after 45 mins by beta countingMore data for this Ligand-Target Pair

Affinity DataKi: 96nM ΔG°: -40.1kJ/molepH: 7.4 T: 2°CAssay Description:The progress of DPPIV inhibition by compounds was measured by recording the liberation of free pNA at 405 nm. IC50 was determined from the slope of r...More data for this Ligand-Target Pair
Affinity DataKi: 160nM ΔG°: -38.8kJ/molepH: 7.4 T: 2°CAssay Description:The progress of DPPIV inhibition by compounds was measured by recording the liberation of free pNA at 405 nm. IC50 was determined from the slope of r...More data for this Ligand-Target Pair

Affinity DataKi: 166nM ΔG°: -38.7kJ/molepH: 7.4 T: 2°CAssay Description:The progress of DPPIV inhibition by compounds was measured by recording the liberation of free pNA at 405 nm. IC50 was determined from the slope of r...More data for this Ligand-Target Pair
Affinity DataKi: 170nM ΔG°: -38.6kJ/molepH: 7.4 T: 2°CAssay Description:The progress of DPPIV inhibition by compounds was measured by recording the liberation of free pNA at 405 nm. IC50 was determined from the slope of r...More data for this Ligand-Target Pair

Affinity DataKi: 252nMAssay Description:Displacement of [3H]M-MPEP from mGluR5 in Sprague-Dawley rat brain P2 membrane after 45 mins by beta countingMore data for this Ligand-Target Pair

Affinity DataKi: 310nM ΔG°: -37.1kJ/molepH: 7.4 T: 2°CAssay Description:The progress of DPPIV inhibition by compounds was measured by recording the liberation of free pNA at 405 nm. IC50 was determined from the slope of r...More data for this Ligand-Target Pair
Affinity DataKi: 355nM ΔG°: -36.8kJ/molepH: 7.4 T: 2°CAssay Description:The progress of DPPIV inhibition by compounds was measured by recording the liberation of free pNA at 405 nm. IC50 was determined from the slope of r...More data for this Ligand-Target Pair

Affinity DataKi: 360nM ΔG°: -36.8kJ/molepH: 7.4 T: 2°CAssay Description:The progress of DPPIV inhibition by compounds was measured by recording the liberation of free pNA at 405 nm. IC50 was determined from the slope of r...More data for this Ligand-Target Pair

Affinity DataKi: 470nM ΔG°: -36.1kJ/molepH: 7.4 T: 2°CAssay Description:The progress of DPPIV inhibition by compounds was measured by recording the liberation of free pNA at 405 nm. IC50 was determined from the slope of r...More data for this Ligand-Target Pair

Affinity DataKi: 980nM ΔG°: -34.3kJ/molepH: 7.4 T: 2°CAssay Description:The progress of DPPIV inhibition by compounds was measured by recording the liberation of free pNA at 405 nm. IC50 was determined from the slope of r...More data for this Ligand-Target Pair

Affinity DataKi: 1.16E+3nM ΔG°: -33.9kJ/molepH: 7.4 T: 2°CAssay Description:The progress of DPPIV inhibition by compounds was measured by recording the liberation of free pNA at 405 nm. IC50 was determined from the slope of r...More data for this Ligand-Target Pair
Affinity DataKi: 8.90E+3nM ΔG°: -28.8kJ/molepH: 7.4 T: 2°CAssay Description:The progress of DPPIV inhibition by compounds was measured by recording the liberation of free pNA at 405 nm. IC50 was determined from the slope of r...More data for this Ligand-Target Pair
Affinity DataKi: >1.28E+4nM ΔG°: >-27.9kJ/molepH: 7.4 T: 2°CAssay Description:The progress of DPPIV inhibition by compounds was measured by recording the liberation of free pNA at 405 nm. IC50 was determined from the slope of r...More data for this Ligand-Target Pair
Affinity DataKi: >1.28E+4nM ΔG°: >-27.9kJ/molepH: 7.4 T: 2°CAssay Description:The progress of DPPIV inhibition by compounds was measured by recording the liberation of free pNA at 405 nm. IC50 was determined from the slope of r...More data for this Ligand-Target Pair
Affinity DataKi: >1.28E+4nM ΔG°: >-27.9kJ/molepH: 7.4 T: 2°CAssay Description:The progress of DPPIV inhibition by compounds was measured by recording the liberation of free pNA at 405 nm. IC50 was determined from the slope of r...More data for this Ligand-Target Pair
Affinity DataKi: >1.28E+4nM ΔG°: >-27.9kJ/molepH: 7.4 T: 2°CAssay Description:The progress of DPPIV inhibition by compounds was measured by recording the liberation of free pNA at 405 nm. IC50 was determined from the slope of r...More data for this Ligand-Target Pair

Affinity DataKi: >1.28E+4nM ΔG°: >-27.9kJ/molepH: 7.4 T: 2°CAssay Description:The progress of DPPIV inhibition by compounds was measured by recording the liberation of free pNA at 405 nm. IC50 was determined from the slope of r...More data for this Ligand-Target Pair
TargetGamma-aminobutyric acid type B receptor subunit 1/2(Rattus norvegicus (Rat))
Ciba-Geigy
Curated by ChEMBL
Ciba-Geigy
Curated by ChEMBL
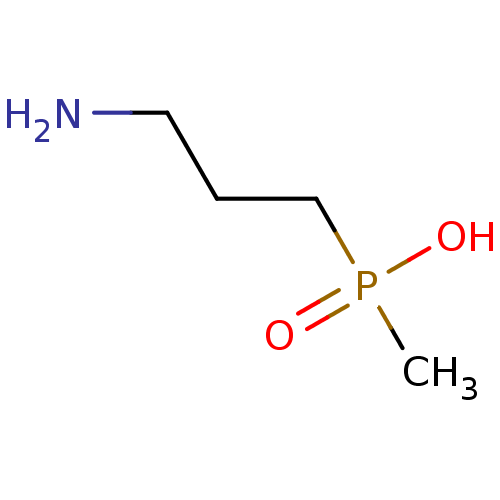
Affinity DataIC50: 0.0160nMAssay Description:Inhibition of [3H]-CGP-27,492 binding to Gamma-aminobutyric acid type B receptor of rat cortexMore data for this Ligand-Target Pair
 3D Structure (crystal)
Affinity DataIC50: 1nMAssay Description:Inhibition of purified activated FAK kinase domain (410-689) using ATP and Glu and Tyr random peptide polymer substrate by fluorescence polarization ...More data for this Ligand-Target Pair
TargetReceptor-type tyrosine-protein kinase FLT3(Homo sapiens (Human))
Johnson And Johnson Pharmaceutical Research And Development
Curated by ChEMBL
Johnson And Johnson Pharmaceutical Research And Development
Curated by ChEMBL
Affinity DataIC50: 1nMAssay Description:Inhibition of human FLT3More data for this Ligand-Target Pair
TargetGamma-aminobutyric acid type B receptor subunit 1/2(Homo sapiens (Human))
Ciba-Geigy
Curated by ChEMBL
Ciba-Geigy
Curated by ChEMBL

Affinity DataIC50: 2.40nMAssay Description:Inhibition of [3H]-baclofen binding to Gamma-aminobutyric acid type B receptor of cat cerebellumMore data for this Ligand-Target Pair
TargetReceptor-type tyrosine-protein kinase FLT3(Homo sapiens (Human))
Johnson And Johnson Pharmaceutical Research And Development
Curated by ChEMBL
Johnson And Johnson Pharmaceutical Research And Development
Curated by ChEMBL
Affinity DataIC50: 3nMAssay Description:Inhibition of human FLT3More data for this Ligand-Target Pair