 Found 328 of ph data with Target = 'Procathepsin L'
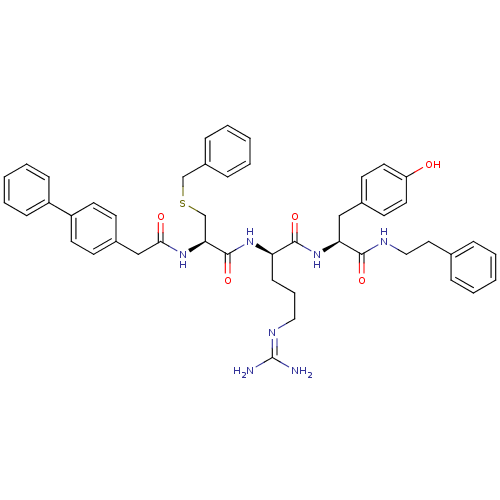
Affinity DataKi: 0.0400nM ΔG°: -58.8kJ/molepH: 5.5 T: 2°CAssay Description:Potential inhibitors were evaluated using the progress curve method. Assays were carried out in the presence of variable concentrations of test compo...More data for this Ligand-Target Pair

Affinity DataKi: 0.0680nM ΔG°: -57.4kJ/molepH: 5.5 T: 2°CAssay Description:Potential inhibitors were evaluated using the progress curve method. Assays were carried out in the presence of variable concentrations of test compo...More data for this Ligand-Target Pair

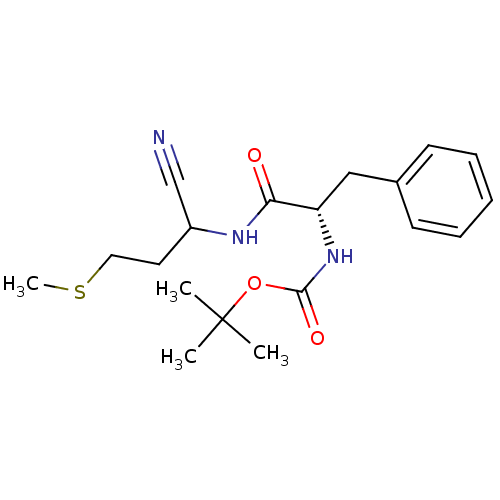
Affinity DataKi: 0.630nM ΔG°: -52.0kJ/molepH: 5.5 T: 2°CAssay Description:Potential inhibitors were evaluated using the progress curve method. Assays were carried out in the presence of variable concentrations of test compo...More data for this Ligand-Target Pair

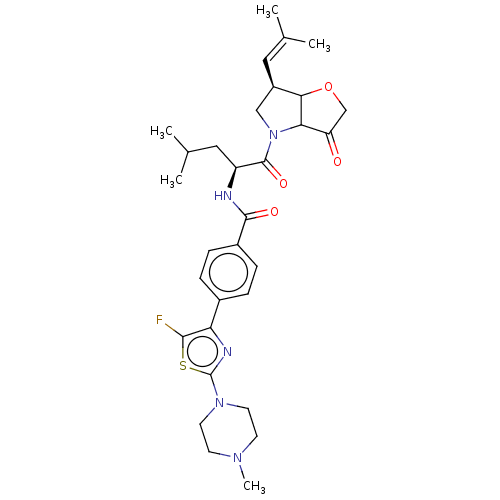
Affinity DataKi: 2.20nM ΔG°: -48.9kJ/molepH: 5.5 T: 2°CAssay Description:Potential inhibitors were evaluated using the progress curve method. Assays were carried out in the presence of variable concentrations of test compo...More data for this Ligand-Target Pair
Affinity DataKi: 3.90nM ΔG°: -47.5kJ/molepH: 5.5 T: 2°CAssay Description:Potential inhibitors were evaluated using the progress curve method. Assays were carried out in the presence of variable concentrations of test compo...More data for this Ligand-Target Pair

Affinity DataKi: 4.20nM ΔG°: -47.3kJ/molepH: 5.5 T: 2°CAssay Description:Potential inhibitors were evaluated using the progress curve method. Assays were carried out in the presence of variable concentrations of test compo...More data for this Ligand-Target Pair

Affinity DataKi: 4.5nM ΔG°: -47.2kJ/molepH: 5.5 T: 2°CAssay Description:Potential inhibitors were evaluated using the progress curve method. Assays were carried out in the presence of variable concentrations of test compo...More data for this Ligand-Target Pair
Affinity DataKi: 7.90nM ΔG°: -45.8kJ/molepH: 5.5 T: 2°CAssay Description:Potential inhibitors were evaluated using the progress curve method. Assays were carried out in the presence of variable concentrations of test compo...More data for this Ligand-Target Pair

Affinity DataKi: 10nM ΔG°: -45.2kJ/molepH: 5.5 T: 2°CAssay Description:Potential inhibitors were evaluated using the progress curve method. Assays were carried out in the presence of variable concentrations of test compo...More data for this Ligand-Target Pair

Affinity DataKi: 19nM ΔG°: -44.1kJ/molepH: 5.5 T: 2°CAssay Description:Fluorescence was monitored on a SPEX Fluorolog-2 spectrofluorometer with the excitation and emission wavelengths set at 380 and 440 nm, respectively....More data for this Ligand-Target Pair
Affinity DataKi: 21nM ΔG°: -43.8kJ/molepH: 5.5 T: 2°CAssay Description:Fluorescence was monitored on a SPEX Fluorolog-2 spectrofluorometer with the excitation and emission wavelengths set at 380 and 440 nm, respectively....More data for this Ligand-Target Pair
Affinity DataKi: 23nM ΔG°: -43.6kJ/molepH: 5.5 T: 2°CAssay Description:Fluorescence was monitored on a SPEX Fluorolog-2 spectrofluorometer with the excitation and emission wavelengths set at 380 and 440 nm, respectively....More data for this Ligand-Target Pair
Affinity DataKi: 24nM ΔG°: -43.5kJ/molepH: 5.5 T: 2°CAssay Description:Fluorescence was monitored on a SPEX Fluorolog-2 spectrofluorometer with the excitation and emission wavelengths set at 380 and 440 nm, respectively....More data for this Ligand-Target Pair
Affinity DataKi: 45nM ΔG°: -41.5kJ/molepH: 5.5 T: 2°CAssay Description:Potential inhibitors were evaluated using the progress curve method. Assays were carried out in the presence of variable concentrations of test compo...More data for this Ligand-Target Pair
Affinity DataKi: 45nM ΔG°: -41.9kJ/molepH: 5.5 T: 2°CAssay Description:Fluorescence was monitored on a SPEX Fluorolog-2 spectrofluorometer with the excitation and emission wavelengths set at 380 and 440 nm, respectively....More data for this Ligand-Target Pair

Affinity DataKi: 52nM ΔG°: -41.2kJ/molepH: 5.5 T: 2°CAssay Description:Potential inhibitors were evaluated using the progress curve method. Assays were carried out in the presence of variable concentrations of test compo...More data for this Ligand-Target Pair
Affinity DataKi: 112nM ΔG°: -39.7kJ/molepH: 5.5 T: 2°CAssay Description:Fluorescence was monitored on a SPEX Fluorolog-2 spectrofluorometer with the excitation and emission wavelengths set at 380 and 440 nm, respectively....More data for this Ligand-Target Pair

Affinity DataKi: 150nM ΔG°: -38.6kJ/molepH: 5.5 T: 2°CAssay Description:Potential inhibitors were evaluated using the progress curve method. Assays were carried out in the presence of variable concentrations of test compo...More data for this Ligand-Target Pair
Affinity DataKi: 155nM ΔG°: -38.9kJ/molepH: 5.5 T: 2°CAssay Description:Fluorescence was monitored on a SPEX Fluorolog-2 spectrofluorometer with the excitation and emission wavelengths set at 380 and 440 nm, respectively....More data for this Ligand-Target Pair
 3D Structure (crystal)
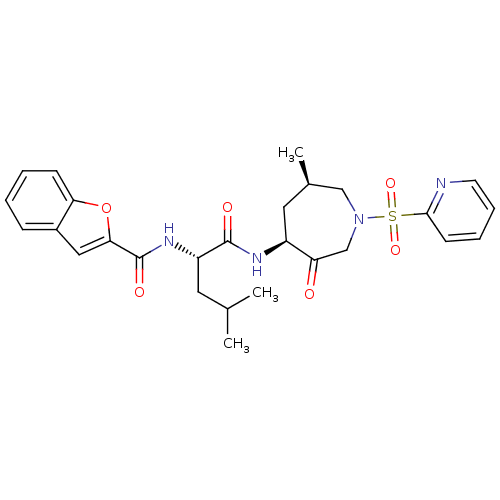
Affinity DataKi: 160nM ΔG°: -38.4kJ/molepH: 5.5 T: 2°CAssay Description:Potential inhibitors were evaluated using the progress curve method. Assays were carried out in the presence of variable concentrations of test compo...More data for this Ligand-Target Pair
Affinity DataKi: 270nM ΔG°: -39.0kJ/molepH: 6.0 T: 2°CAssay Description:Cathepsin enzyme activities were calculated from kinetic measurements performed by fluorimetric detection of the product 7-amino-4-methylcoumarin at ...More data for this Ligand-Target Pair
Affinity DataKi: 300nMpH: 7.0Assay Description:Standard assay conditions for the determination of kinetic constants used a fluorogenic peptide substrate, typically H-D-Ala-Leu-Lys-AMC, and were de...More data for this Ligand-Target Pair

Affinity DataKi: 460nM ΔG°: -36.2kJ/molepH: 5.5 T: 2°CAssay Description:Fluorescence was monitored on a SPEX Fluorolog-2 spectrofluorometer with the excitation and emission wavelengths set at 380 and 440 nm, respectively....More data for this Ligand-Target Pair

Affinity DataKi: 464nM ΔG°: -36.1kJ/molepH: 5.5 T: 2°CAssay Description:Fluorescence was monitored on a SPEX Fluorolog-2 spectrofluorometer with the excitation and emission wavelengths set at 380 and 440 nm, respectively....More data for this Ligand-Target Pair

Affinity DataKi: 511nM ΔG°: -35.9kJ/molepH: 5.5 T: 2°CAssay Description:Fluorescence was monitored on a SPEX Fluorolog-2 spectrofluorometer with the excitation and emission wavelengths set at 380 and 440 nm, respectively....More data for this Ligand-Target Pair

Affinity DataKi: 520nM ΔG°: -37.3kJ/molepH: 6.0 T: 2°CAssay Description:Cathepsin enzyme activities were calculated from kinetic measurements performed by fluorimetric detection of the product 7-amino-4-methylcoumarin at ...More data for this Ligand-Target Pair
Affinity DataKi: 751nMpH: 7.0Assay Description:Standard assay conditions for the determination of kinetic constants used a fluorogenic peptide substrate, typically H-D-Ala-Leu-Lys-AMC, and were de...More data for this Ligand-Target Pair
Affinity DataKi: 900nM ΔG°: -35.9kJ/molepH: 6.0 T: 2°CAssay Description:Cathepsin enzyme activities were calculated from kinetic measurements performed by fluorimetric detection of the product 7-amino-4-methylcoumarin at ...More data for this Ligand-Target Pair
Affinity DataKi: 1.17E+3nMpH: 7.0Assay Description:Standard assay conditions for the determination of kinetic constants used a fluorogenic peptide substrate, typically H-D-Ala-Leu-Lys-AMC, and were de...More data for this Ligand-Target Pair
Affinity DataKi: 1.40E+3nMpH: 7.0Assay Description:Standard assay conditions for the determination of kinetic constants used a fluorogenic peptide substrate, typically H-D-Ala-Leu-Lys-AMC, and were de...More data for this Ligand-Target Pair
Affinity DataKi: 1.54E+3nM ΔG°: -34.5kJ/molepH: 6.1 T: 2°CAssay Description:The proteolytic cleavage of N-acyl aminocoumarins by cathepsins was conducted in Dynatech Microfluor fluorescence 96-well microtiter plates, and read...More data for this Ligand-Target Pair
Affinity DataKi: 1.70E+3nMpH: 7.0Assay Description:Standard assay conditions for the determination of kinetic constants used a fluorogenic peptide substrate, typically H-D-Ala-Leu-Lys-AMC, and were de...More data for this Ligand-Target Pair
Affinity DataKi: 2.00E+3nMpH: 7.0Assay Description:Standard assay conditions for the determination of kinetic constants used a fluorogenic peptide substrate, typically H-D-Ala-Leu-Lys-AMC, and were de...More data for this Ligand-Target Pair
Affinity DataKi: 3.00E+3nMpH: 7.0Assay Description:Standard assay conditions for the determination of kinetic constants used a fluorogenic peptide substrate, typically H-D-Ala-Leu-Lys-AMC, and were de...More data for this Ligand-Target Pair
Affinity DataKi: 3.00E+3nMpH: 7.0Assay Description:Standard assay conditions for the determination of kinetic constants used a fluorogenic peptide substrate, typically H-D-Ala-Leu-Lys-AMC, and were de...More data for this Ligand-Target Pair

Affinity DataKi: 5.19E+3nM ΔG°: -31.4kJ/molepH: 6.1 T: 2°CAssay Description:The proteolytic cleavage of N-acyl aminocoumarins by cathepsins was conducted in Dynatech Microfluor fluorescence 96-well microtiter plates, and read...More data for this Ligand-Target Pair

Affinity DataKi: 6.00E+3nM ΔG°: -29.8kJ/molepH: 5.5 T: 2°CAssay Description:Fluorescence was monitored on a SPEX Fluorolog-2 spectrofluorometer with the excitation and emission wavelengths set at 380 and 440 nm, respectively....More data for this Ligand-Target Pair

Affinity DataKi: >1.00E+4nM ΔG°: >-29.7kJ/molepH: 6.1 T: 2°CAssay Description:The proteolytic cleavage of N-acyl aminocoumarins by cathepsins was conducted in Dynatech Microfluor fluorescence 96-well microtiter plates, and read...More data for this Ligand-Target Pair
Affinity DataKi: >1.00E+4nM ΔG°: >-29.7kJ/molepH: 6.1 T: 2°CAssay Description:The proteolytic cleavage of N-acyl aminocoumarins by cathepsins was conducted in Dynatech Microfluor fluorescence 96-well microtiter plates, and read...More data for this Ligand-Target Pair

Affinity DataKi: >1.00E+4nM ΔG°: >-29.7kJ/molepH: 6.1 T: 2°CAssay Description:The proteolytic cleavage of N-acyl aminocoumarins by cathepsins was conducted in Dynatech Microfluor fluorescence 96-well microtiter plates, and read...More data for this Ligand-Target Pair
Affinity DataKi: >1.00E+4nM ΔG°: >-29.7kJ/molepH: 6.1 T: 2°CAssay Description:The proteolytic cleavage of N-acyl aminocoumarins by cathepsins was conducted in Dynatech Microfluor fluorescence 96-well microtiter plates, and read...More data for this Ligand-Target Pair

Affinity DataKi: 1.07E+4nM ΔG°: -28.4kJ/molepH: 5.5 T: 2°CAssay Description:Fluorescence was monitored on a SPEX Fluorolog-2 spectrofluorometer with the excitation and emission wavelengths set at 380 and 440 nm, respectively....More data for this Ligand-Target Pair
Affinity DataKi: >1.50E+4nM ΔG°: >-28.6kJ/molepH: 6.1 T: 2°CAssay Description:The proteolytic cleavage of N-acyl aminocoumarins by cathepsins was conducted in Dynatech Microfluor fluorescence 96-well microtiter plates, and read...More data for this Ligand-Target Pair

Affinity DataKi: >1.50E+4nM ΔG°: >-28.6kJ/molepH: 6.1 T: 2°CAssay Description:The proteolytic cleavage of N-acyl aminocoumarins by cathepsins was conducted in Dynatech Microfluor fluorescence 96-well microtiter plates, and read...More data for this Ligand-Target Pair
Affinity DataKi: 5.75E+4nM ΔG°: -24.2kJ/molepH: 5.5 T: 2°CAssay Description:Fluorescence was monitored on a SPEX Fluorolog-2 spectrofluorometer with the excitation and emission wavelengths set at 380 and 440 nm, respectively....More data for this Ligand-Target Pair
Affinity DataIC50: 0.170nMpH: 5.5 T: 2°CAssay Description:The substrate hydrolysis with or without inhibitor was monitored at an excitation wavelength of 360nm and an emission wavelength of 460 nm on a fluor...More data for this Ligand-Target Pair
Affinity DataIC50: 0.310nMpH: 5.5 T: 2°CAssay Description:The substrate hydrolysis with or without inhibitor was monitored at an excitation wavelength of 360nm and an emission wavelength of 460 nm on a fluor...More data for this Ligand-Target Pair

Affinity DataIC50: 0.330nMpH: 5.5 T: 2°CAssay Description:The substrate hydrolysis with or without inhibitor was monitored at an excitation wavelength of 360nm and an emission wavelength of 460 nm on a fluor...More data for this Ligand-Target Pair
Affinity DataIC50: 0.340nMpH: 5.5 T: 2°CAssay Description:The substrate hydrolysis with or without inhibitor was monitored at an excitation wavelength of 360nm and an emission wavelength of 460 nm on a fluor...More data for this Ligand-Target Pair
Affinity DataIC50: 0.450nMpH: 5.5 T: 2°CAssay Description:The substrate hydrolysis with or without inhibitor was monitored at an excitation wavelength of 360nm and an emission wavelength of 460 nm on a fluor...More data for this Ligand-Target Pair