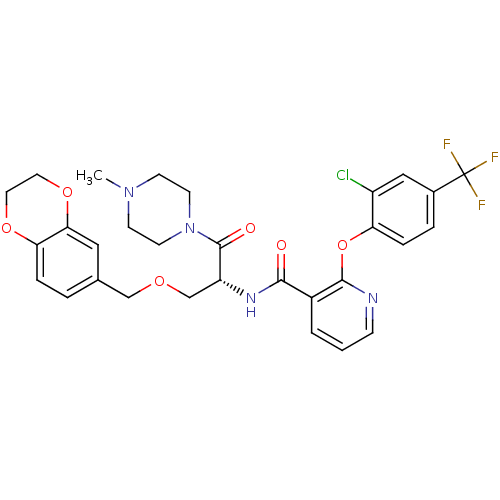
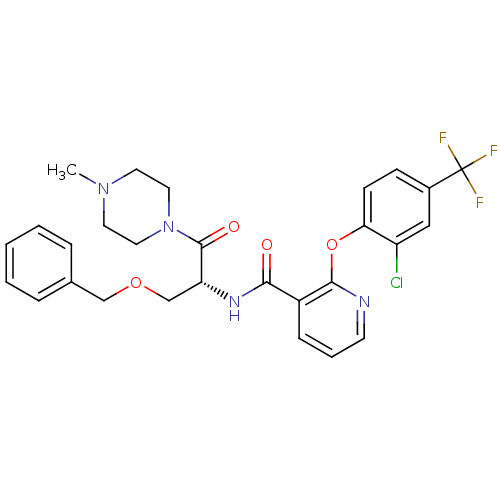
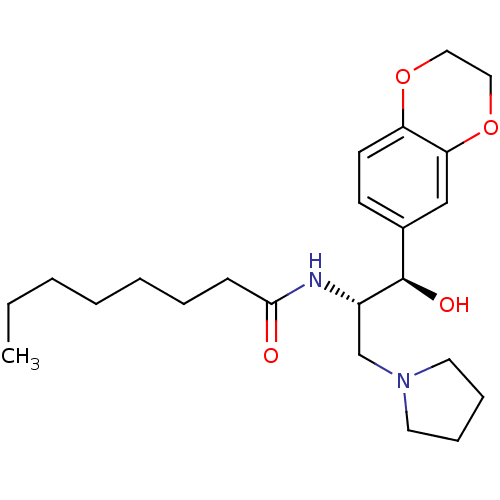
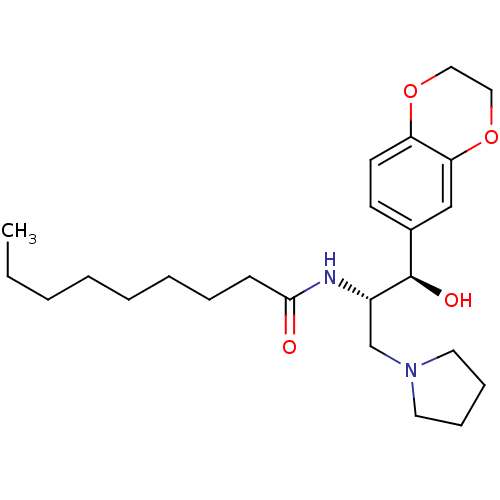
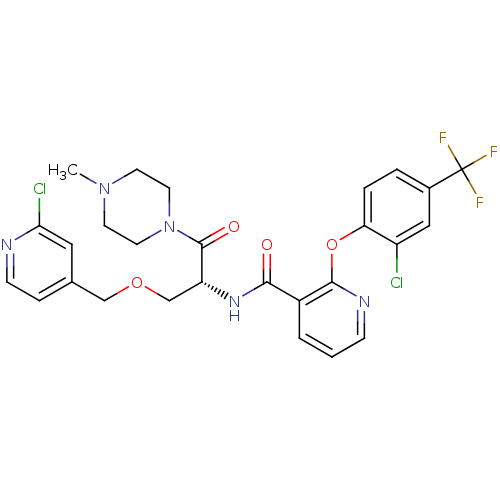
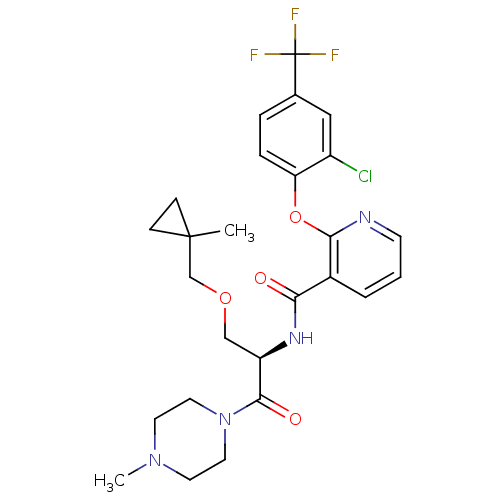
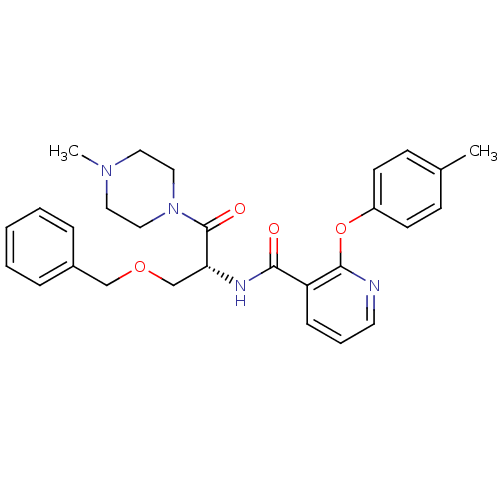
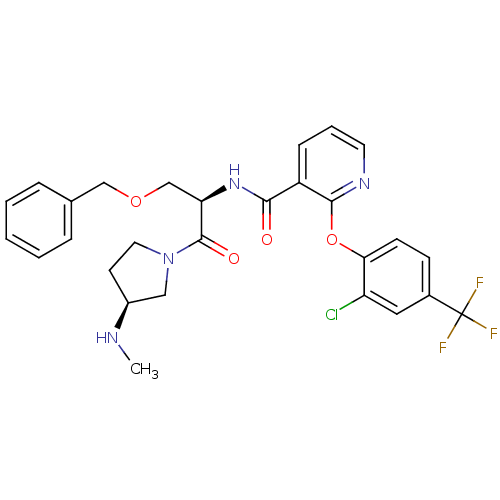
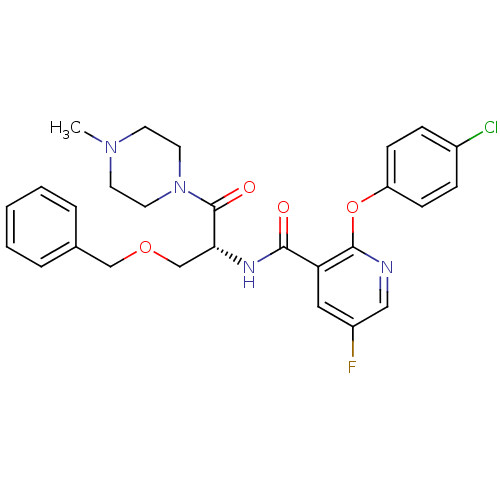
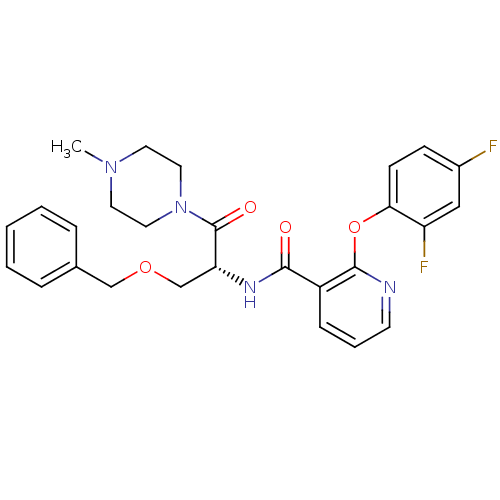
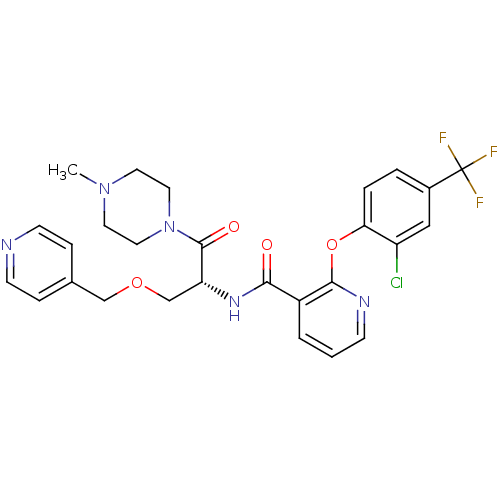
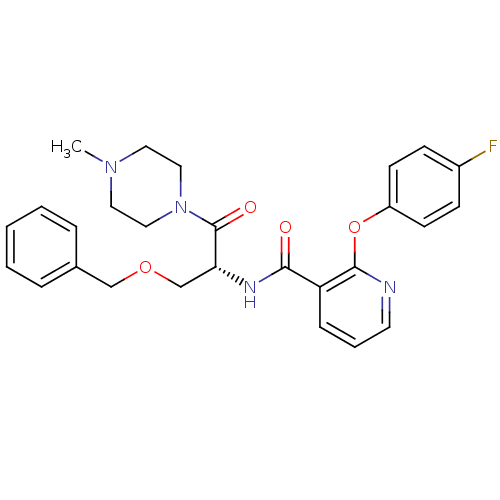
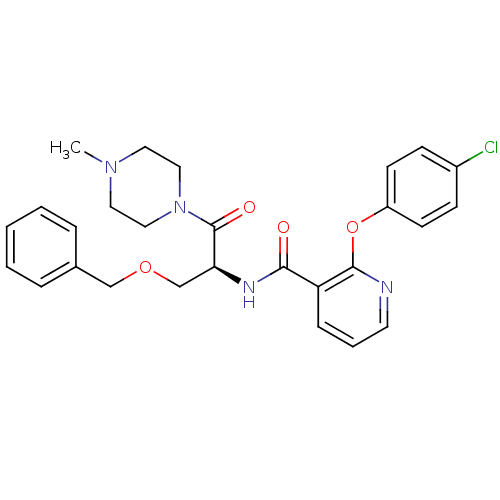
Report error Found 57 Enz. Inhib. hit(s) with all data for entry = 50034057
Affinity DataIC50: 0.300nMAssay Description:Inhibition of GCS activity in human A549 cells assessed as amount of GM1 on the cell membrane after 72 hrs by FL-CTB-based fluorescent microscopyMore data for this Ligand-Target Pair
Affinity DataIC50: 1nMAssay Description:Inhibition of GCS assessed as amount of UDP-glucose consumed during enzyme-catalyzed reactionMore data for this Ligand-Target Pair
Affinity DataIC50: 1nMAssay Description:Inhibition of GCS assessed as amount of UDP-glucose consumed during enzyme-catalyzed reactionMore data for this Ligand-Target Pair
Affinity DataIC50: 2nMAssay Description:Inhibition of GCS activity in human A549 cells assessed as amount of GM1 on the cell membrane after 72 hrs by FL-CTB-based fluorescent microscopyMore data for this Ligand-Target Pair
Affinity DataIC50: 2nMAssay Description:Inhibition of GCS activity in human A549 cells assessed as amount of GM1 on the cell membrane after 72 hrs by FL-CTB-based fluorescent microscopyMore data for this Ligand-Target Pair
Affinity DataIC50: 2nMAssay Description:Inhibition of GCS activity in human A549 cells assessed as amount of GM1 on the cell membrane after 72 hrs by FL-CTB-based fluorescent microscopyMore data for this Ligand-Target Pair
Affinity DataIC50: 2nMAssay Description:Inhibition of GCS assessed as amount of UDP-glucose consumed during enzyme-catalyzed reactionMore data for this Ligand-Target Pair
Affinity DataIC50: 2nMAssay Description:Inhibition of GCS assessed as amount of UDP-glucose consumed during enzyme-catalyzed reactionMore data for this Ligand-Target Pair
Affinity DataIC50: 3nMAssay Description:Inhibition of GCS assessed as amount of UDP-glucose consumed during enzyme-catalyzed reactionMore data for this Ligand-Target Pair
Affinity DataIC50: 4nMAssay Description:Inhibition of GCS activity in human A549 cells assessed as amount of GM1 on the cell membrane after 72 hrs by FL-CTB-based fluorescent microscopyMore data for this Ligand-Target Pair
Affinity DataIC50: 5nMAssay Description:Inhibition of GCS assessed as amount of UDP-glucose consumed during enzyme-catalyzed reactionMore data for this Ligand-Target Pair
Affinity DataIC50: 5nMAssay Description:Inhibition of GCS activity in human A549 cells assessed as amount of GM1 on the cell membrane after 72 hrs by FL-CTB-based fluorescent microscopyMore data for this Ligand-Target Pair
Affinity DataIC50: 7nMAssay Description:Inhibition of GCS assessed as amount of UDP-glucose consumed during enzyme-catalyzed reactionMore data for this Ligand-Target Pair
Affinity DataIC50: 7nMAssay Description:Inhibition of GCS assessed as amount of UDP-glucose consumed during enzyme-catalyzed reactionMore data for this Ligand-Target Pair
Affinity DataIC50: 9nMAssay Description:Inhibition of GCS assessed as amount of UDP-glucose consumed during enzyme-catalyzed reactionMore data for this Ligand-Target Pair
Affinity DataIC50: 10nMAssay Description:Inhibition of GCS assessed as amount of UDP-glucose consumed during enzyme-catalyzed reactionMore data for this Ligand-Target Pair
Affinity DataIC50: 12nMAssay Description:Inhibition of GCS activity in human A549 cells assessed as amount of GM1 on the cell membrane after 72 hrs by FL-CTB-based fluorescent microscopyMore data for this Ligand-Target Pair
Affinity DataIC50: 13nMAssay Description:Inhibition of GCS activity in human A549 cells assessed as amount of GM1 on the cell membrane after 72 hrs by FL-CTB-based fluorescent microscopyMore data for this Ligand-Target Pair
Affinity DataIC50: 16nMAssay Description:Inhibition of GCS assessed as amount of UDP-glucose consumed during enzyme-catalyzed reactionMore data for this Ligand-Target Pair
Affinity DataIC50: 16nMAssay Description:Inhibition of GCS assessed as amount of UDP-glucose consumed during enzyme-catalyzed reactionMore data for this Ligand-Target Pair
Affinity DataIC50: 20nMAssay Description:Inhibition of GCS assessed as amount of UDP-glucose consumed during enzyme-catalyzed reactionMore data for this Ligand-Target Pair
Affinity DataIC50: 32nMAssay Description:Inhibition of GCS assessed as amount of UDP-glucose consumed during enzyme-catalyzed reactionMore data for this Ligand-Target Pair
Affinity DataIC50: 40nMAssay Description:Inhibition of GCS assessed as amount of UDP-glucose consumed during enzyme-catalyzed reactionMore data for this Ligand-Target Pair
Affinity DataIC50: 50nMAssay Description:Inhibition of GCS assessed as amount of UDP-glucose consumed during enzyme-catalyzed reactionMore data for this Ligand-Target Pair
Affinity DataIC50: 50nMAssay Description:Inhibition of GCS assessed as amount of UDP-glucose consumed during enzyme-catalyzed reactionMore data for this Ligand-Target Pair
Affinity DataIC50: 50nMAssay Description:Inhibition of GCS activity in human A549 cells assessed as amount of GM1 on the cell membrane after 72 hrs by FL-CTB-based fluorescent microscopyMore data for this Ligand-Target Pair
Affinity DataIC50: 53nMAssay Description:Inhibition of GCS assessed as amount of UDP-glucose consumed during enzyme-catalyzed reactionMore data for this Ligand-Target Pair
Affinity DataIC50: 65nMAssay Description:Inhibition of GCS assessed as amount of UDP-glucose consumed during enzyme-catalyzed reactionMore data for this Ligand-Target Pair
Affinity DataIC50: 90nMAssay Description:Inhibition of GCS assessed as amount of UDP-glucose consumed during enzyme-catalyzed reactionMore data for this Ligand-Target Pair
Affinity DataIC50: 90nMAssay Description:Inhibition of GCS assessed as amount of UDP-glucose consumed during enzyme-catalyzed reactionMore data for this Ligand-Target Pair
Affinity DataIC50: 110nMAssay Description:Inhibition of GCS assessed as amount of UDP-glucose consumed during enzyme-catalyzed reactionMore data for this Ligand-Target Pair
Affinity DataIC50: 120nMAssay Description:Inhibition of GCS assessed as amount of UDP-glucose consumed during enzyme-catalyzed reactionMore data for this Ligand-Target Pair
Affinity DataIC50: 180nMAssay Description:Inhibition of GCS assessed as amount of UDP-glucose consumed during enzyme-catalyzed reactionMore data for this Ligand-Target Pair
Affinity DataIC50: 230nMAssay Description:Inhibition of GCS assessed as amount of UDP-glucose consumed during enzyme-catalyzed reactionMore data for this Ligand-Target Pair
Affinity DataIC50: 275nMAssay Description:Inhibition of GCS assessed as amount of UDP-glucose consumed during enzyme-catalyzed reactionMore data for this Ligand-Target Pair
Affinity DataIC50: 300nMAssay Description:Inhibition of GCS assessed as amount of UDP-glucose consumed during enzyme-catalyzed reactionMore data for this Ligand-Target Pair
Affinity DataIC50: 340nMAssay Description:Inhibition of GCS assessed as amount of UDP-glucose consumed during enzyme-catalyzed reactionMore data for this Ligand-Target Pair
Affinity DataIC50: 1.08E+3nMAssay Description:Inhibition of GCS assessed as amount of UDP-glucose consumed during enzyme-catalyzed reactionMore data for this Ligand-Target Pair
Affinity DataIC50: 1.08E+3nMAssay Description:Inhibition of GCS assessed as amount of UDP-glucose consumed during enzyme-catalyzed reactionMore data for this Ligand-Target Pair
Affinity DataIC50: 1.15E+3nMAssay Description:Inhibition of GCS assessed as amount of UDP-glucose consumed during enzyme-catalyzed reactionMore data for this Ligand-Target Pair
Affinity DataIC50: 2.00E+3nMAssay Description:Inhibition of CYP3A4 in human liver microsomes assessed as inhibition of oxidatative metabolism of testosterone after 45 mins by MS analysis in the p...More data for this Ligand-Target Pair
Affinity DataIC50: 2.70E+3nMAssay Description:Inhibition of GCS assessed as amount of UDP-glucose consumed during enzyme-catalyzed reactionMore data for this Ligand-Target Pair
Affinity DataIC50: 3.30E+3nMAssay Description:Inhibition of CYP3A4 in human liver microsomes assessed as inhibition of oxidatative metabolism of testosterone after 45 mins by MS analysis in the p...More data for this Ligand-Target Pair
Affinity DataIC50: 5.40E+3nMAssay Description:Inhibition of CYP3A4 in human liver microsomes assessed as inhibition of oxidatative metabolism of testosterone after 45 mins by MS analysis in the p...More data for this Ligand-Target Pair
Affinity DataIC50: 6.30E+3nMAssay Description:Inhibition of CYP3A4 in human liver microsomes assessed as inhibition of oxidatative metabolism of testosterone after 45 mins by MS analysis in the p...More data for this Ligand-Target Pair
Affinity DataIC50: 7.20E+3nMAssay Description:Inhibition of CYP3A4 in human liver microsomes assessed as inhibition of oxidatative metabolism of testosterone after 45 mins by MS analysis in the p...More data for this Ligand-Target Pair
Affinity DataIC50: 9.00E+3nMAssay Description:Inhibition of CYP3A4 in human liver microsomes assessed as inhibition of oxidatative metabolism of testosterone after 45 mins by MS analysis in the p...More data for this Ligand-Target Pair
Affinity DataIC50: 1.10E+4nMAssay Description:Inhibition of CYP3A4 in human liver microsomes assessed as inhibition of oxidatative metabolism of testosterone after 45 mins by MS analysis in the p...More data for this Ligand-Target Pair
Affinity DataIC50: 1.20E+4nMAssay Description:Inhibition of CYP3A4 in human liver microsomes assessed as inhibition of oxidatative metabolism of testosterone after 45 mins by MS analysis in the p...More data for this Ligand-Target Pair
Affinity DataIC50: 1.20E+4nMAssay Description:Inhibition of CYP3A4 in human liver microsomes assessed as inhibition of oxidatative metabolism of testosterone after 45 mins by MS analysis in the p...More data for this Ligand-Target Pair
